開年發力!上週對衝基金大舉做空美國科技股、大力做多中國股市
高盛報告顯示,上週全球股市中美股被淨賣出的力度最大,降至2019年11月以來最低的低配水平;中國股市被淨買入最多,超配比爲2020年10月以來最高。上週對衝基金對TMT(科技媒體通信)行業股票的淨賣出規模爲九個月來最大。
摩根大通發現,2022年最後一週美股散戶瘋狂撤資,同時在該行主經紀商報告中警告空頭,將遭遇科技股主導的逼空。高盛的主經紀商報告的上週數據正體現了科技股被大舉多空的形勢。
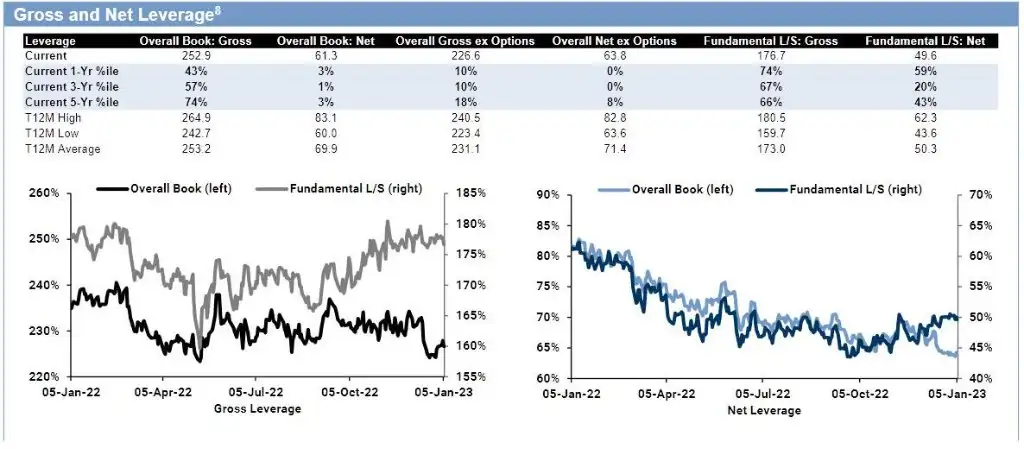
高盛上述報告發現,在2023年開年的上週,對衝基金的總交易單淨槓桿規模回落到2019年6月以來最低位,不過基本的多/空淨槓桿脫離低位,回升到約一年來的平均水平,部分源於專注多空策略的基金經理最近持有的中國淨風險敞口增加。
上述報告顯示,截至上週,對衝基金的總交易資金流連續兩週增加,投資呈淨賣空態勢,賣空交易的資金和買多的資金之比爲2:1;單一個股遭遇七週來最大規模的單週淨賣空;宏觀產品小幅淨買入。
分地區看:
-
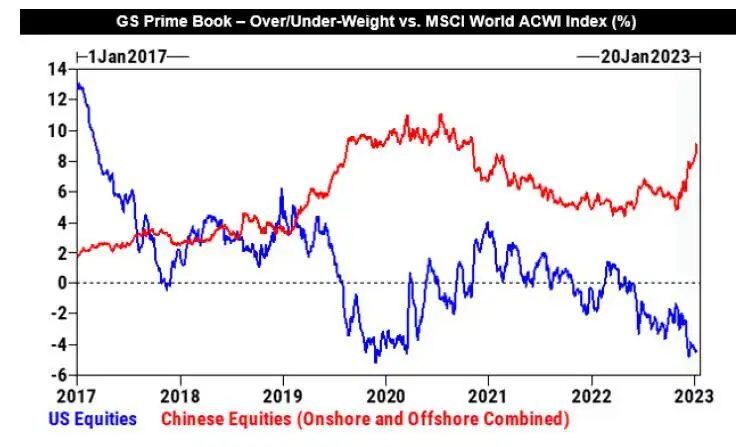
北美是遭到淨賣出最多的地區,美國股市被淨賣出的力度最大,主要由賣空驅動,美股的配置比MSCI ACWI全球指數低4.9%,降至2019年11月以來最低的低配水平;
-
上週新興市場亞洲國家和歐洲是淨買入最多的地區,均由買多驅動。
-
中國股市上週被淨買入最多,淨買入規模創12月初以來新高,主要源於A股買多,美股ADR的買多規模相對較小;而且中國股市已連續第三週、最近六週內第五週被淨買入,截至上週五的過去13個交易日裏,每日都是淨買入,在岸和離岸中國股市的合計配置比MSCI ACWI全球指數高9.5%,超配比爲2020年10月以來最高水平。
-
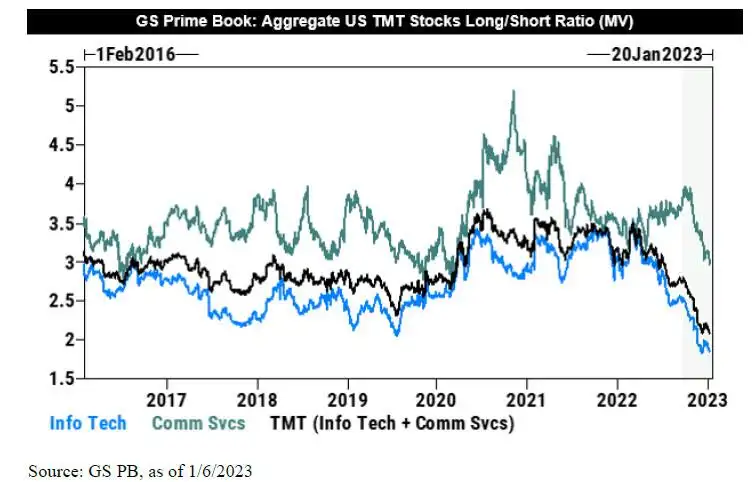
上週美股標普成份股的累計多空倉之比爲1.9,處於將近五年來低位,而中概ADR的累計多空倉之比爲4.1%,處於一年來高位,比過去五年中67%的時期都高。
分板塊看,11個美股板塊中,八個上週都被淨賣出,爲首的是信息技術(IT)板塊、醫療健康、通信服務和能源也被淨賣出,而金融、房地產和材料都是被淨買入的板塊。
在上週五的美國非農就業報告公佈前,對衝基金就在大舉淨賣出TMT——即科技、媒體和通信行業的股票,這類行業股佔所有美國單一個股名義淨賣出總規模的70%。
截至上週的最近12周內,對衝基金有十週都淨賣出TMT股票,上週的名義淨賣出規模爲九個月來最大,比過去五年中98%的時期規模都高。上週幾乎所有的TMT細分板塊都被淨賣出,爲首的是IT服務、半導體和半導體設備,以及軟件。
上週美股信息技術板塊和TMT行業股的合計多空倉之比分別爲1.85和2.08,均爲2016年初高盛有記錄以來最低水平。TMT相比標普500指數超配/低配比爲-4.6%,接近五年低位,低於五年間99%的時期。
Follow us
Find us on
Facebook,
Twitter ,
Instagram, and
YouTube or frequent updates on all things investing.Have a financial topic you would like to discuss? Head over to the
uSMART Community to share your thoughts and insights about the market! Click the picture below to download and explore uSMART app!

Disclaimers
uSmart Securities Limited (“uSmart”) is based on its internal research and public third party information in preparation of this article. Although uSmart uses its best endeavours to ensure the content of this article is accurate, uSmart does not guarantee the accuracy, timeliness or completeness of the information of this article and is not responsible for any views/opinions/comments in this article. Opinions, forecasts and estimations reflect uSmart’s assessment as of the date of this article and are subject to change. uSmart has no obligation to notify you or anyone of any such changes. You must make independent analysis and judgment on any matters involved in this article. uSmart and any directors, officers, employees or agents of uSmart will not be liable for any loss or damage suffered by any person in reliance on any representation or omission in the content of this article. The content of the article is for reference only and does not constitute any offer, solicitation, recommendation, opinion or guarantee of any securities, virtual assets, financial products or instruments. Regulatory authorities may restrict the trading of virtual asset-related ETFs to only investors who meet specified requirements. Any calculations or images in the article are for illustrative purposes only.
Investment involves risks and the value and income from securities may rise or fall. Past performance is not indicative of future performance. Please carefully consider your personal risk tolerance, and consult independent professional advice if necessary.