形態選股 | 12月21日
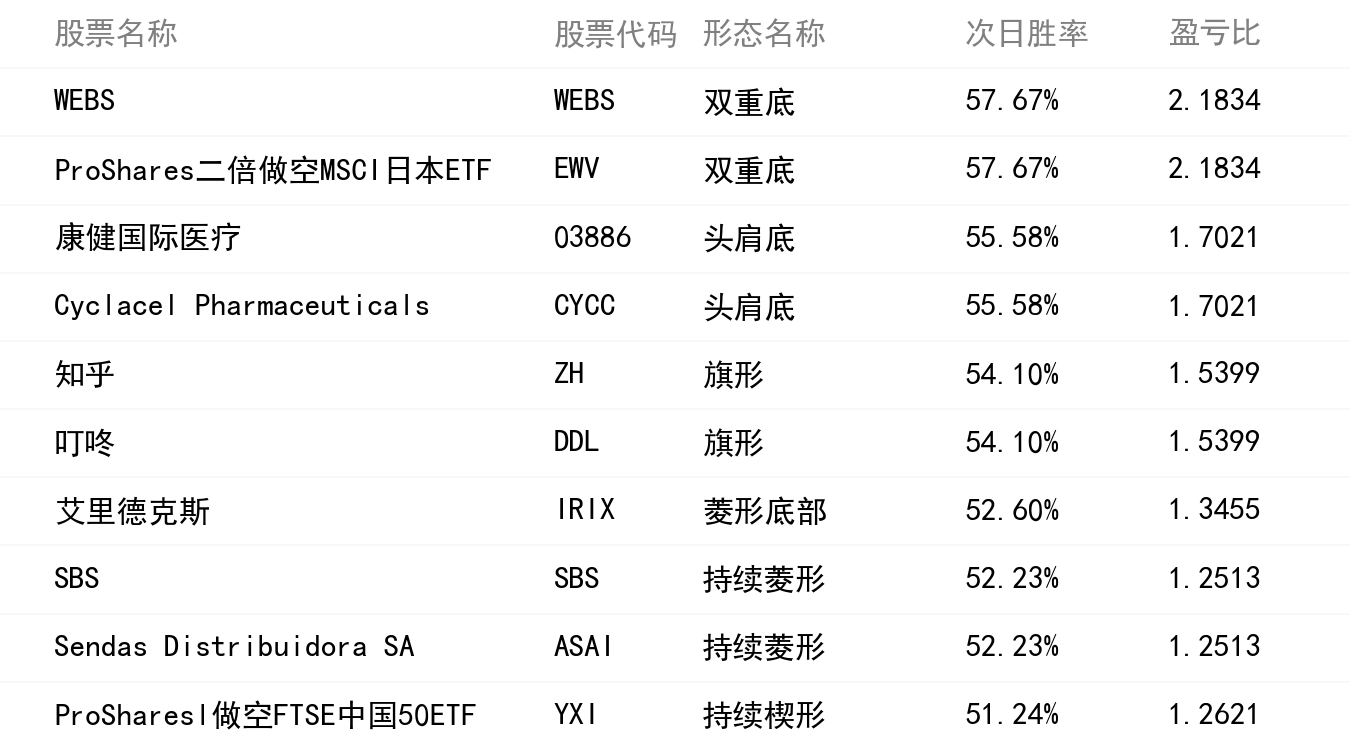
形態勝率排行榜
大家好,我是uSMART的K線形態大師,今天有多個股票觸發利好形態,基於形態勝率和股票成交量,爲大家挑選出如下有上漲潛力的股票,詳細信息請查看App上的《洞察形態》。
Direxion Daily Dow Jones Internet Bear 3x Shares
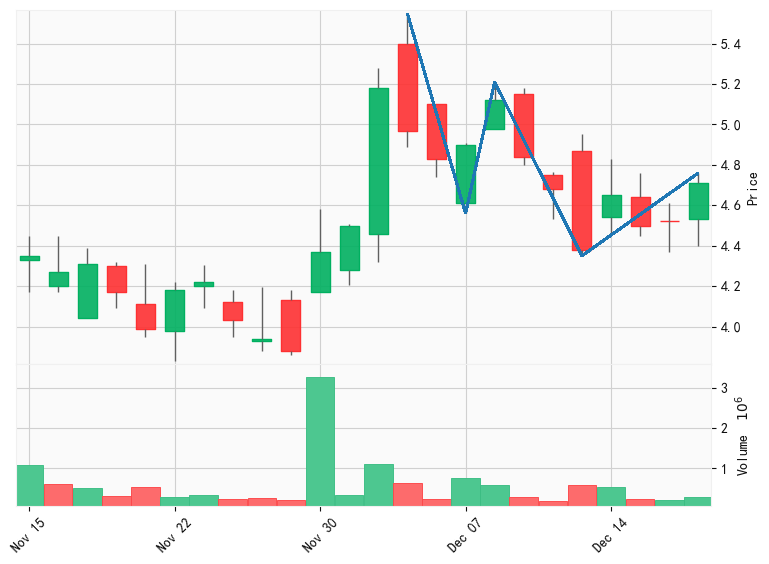
Direxion Daily Dow Jones Internet Bear 3x Shares(WEBS)於2022-12-19日觸發雙重底利好形態。形態回測:近五年,該形態共出現1151次,次日上漲概率57.67%,平均漲幅3.43%,盈虧比爲2.18;持倉一月上漲概率86.05%,平均漲幅12.76%,盈虧比爲7.18。
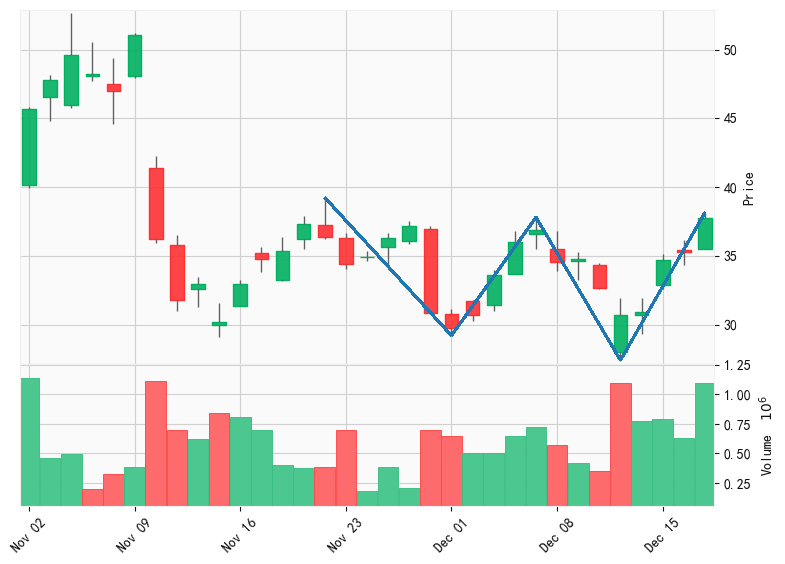
ProShares二倍做空MSCI日本ETF
ProShares二倍做空MSCI日本ETF(EWV)於2022-12-19日觸發雙重底利好形態。形態回測:近五年,該形態共出現1151次,次日上漲概率57.67%,平均漲幅3.43%,盈虧比爲2.18;持倉一月上漲概率86.05%,平均漲幅12.76%,盈虧比爲7.18。
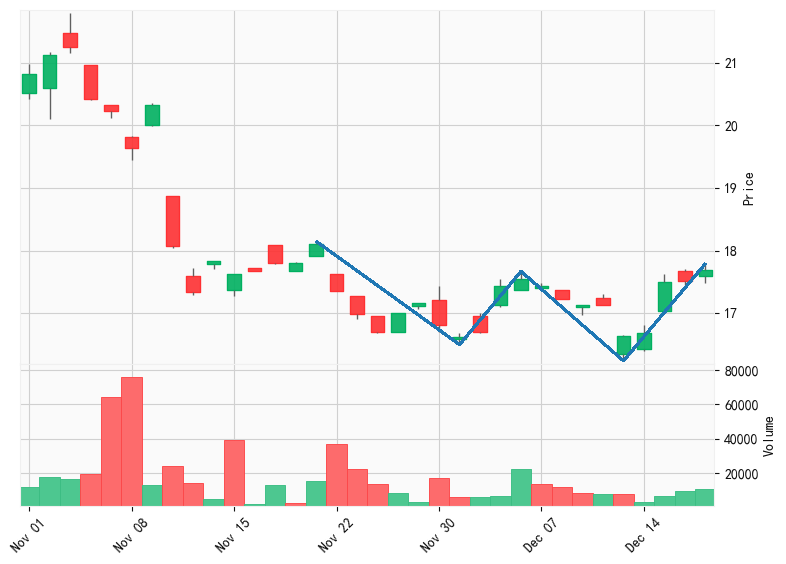
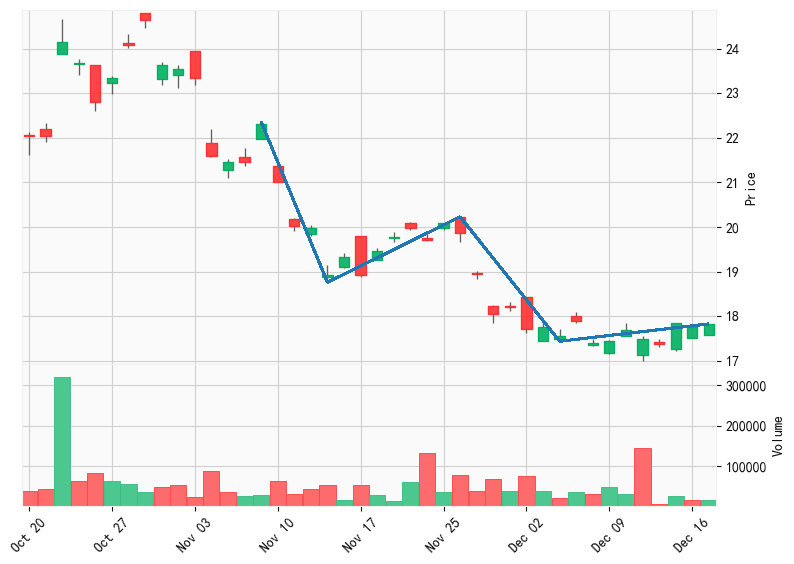
康健國際醫療
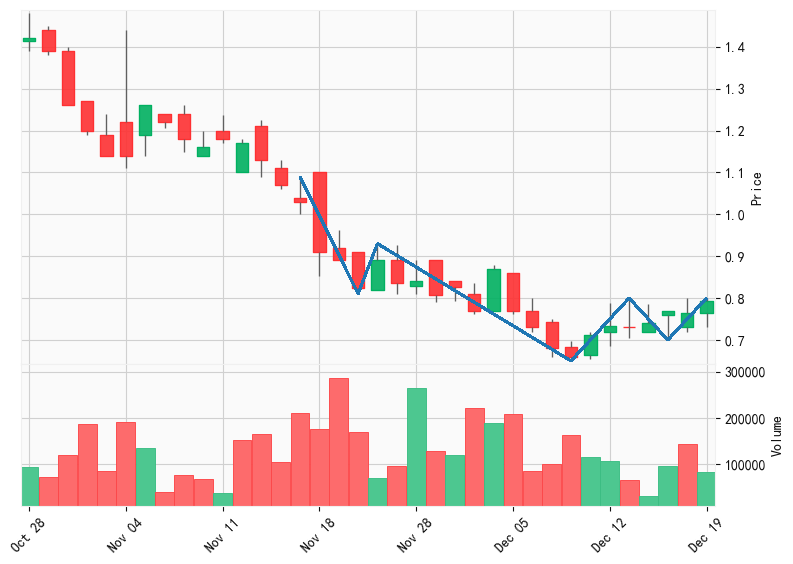
康健國際醫療(03886)於2022-12-20日觸發頭肩底利好形態。形態回測:近五年,該形態共出現2272次,次日上漲概率55.58%,平均漲幅2.87%,盈虧比爲1.7;持倉一月上漲概率80.00%,平均漲幅13.02%,盈虧比爲5.44。
Cyclacel Pharmaceuticals
Cyclacel Pharmaceuticals(CYCC)於2022-12-19日觸發頭肩底利好形態。形態回測:近五年,該形態共出現2272次,次日上漲概率55.58%,平均漲幅2.87%,盈虧比爲1.7;持倉一月上漲概率80.00%,平均漲幅13.02%,盈虧比爲5.44。
知乎
知乎(ZH)於2022-12-19日觸發旗形(看漲)利好形態。形態回測:近五年,該形態共出現122次,次日上漲概率54.10%,平均漲幅2.60%,盈虧比爲1.54;持倉一月上漲概率40.00%,平均漲幅10.42%,盈虧比爲0.73。

叮咚
叮咚(DDL)於2022-12-19日觸發旗形(看漲)利好形態。形態回測:近五年,該形態共出現122次,次日上漲概率54.10%,平均漲幅2.60%,盈虧比爲1.54;持倉一月上漲概率40.00%,平均漲幅10.42%,盈虧比爲0.73。
艾裏德克斯
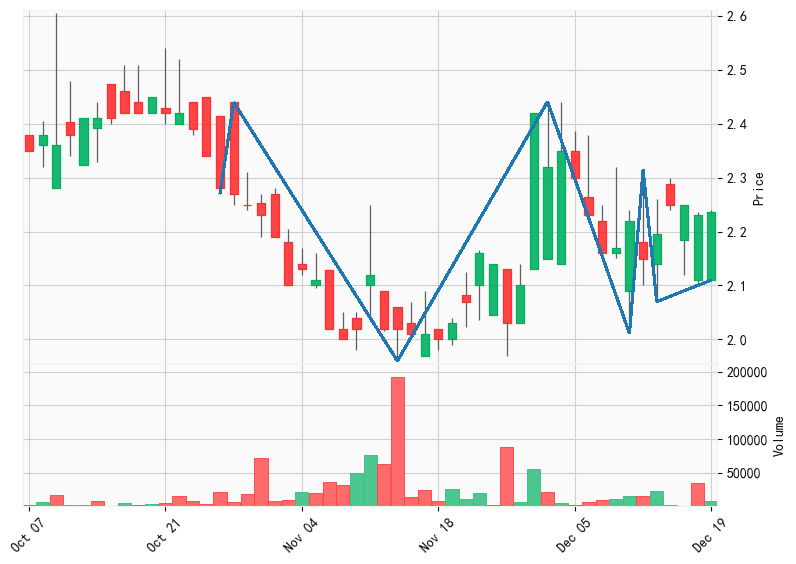
艾裏德克斯(IRIX)於2022-12-19日觸發菱形底部利好形態。形態回測:近五年,該形態共出現856次,次日上漲概率52.60%,平均漲幅2.91%,盈虧比爲1.35;持倉一月上漲概率66.61%,平均漲幅14.19%,盈虧比爲2.92。
Companhia de Saneamento Basico do Estado de Sao Paulo SABESP
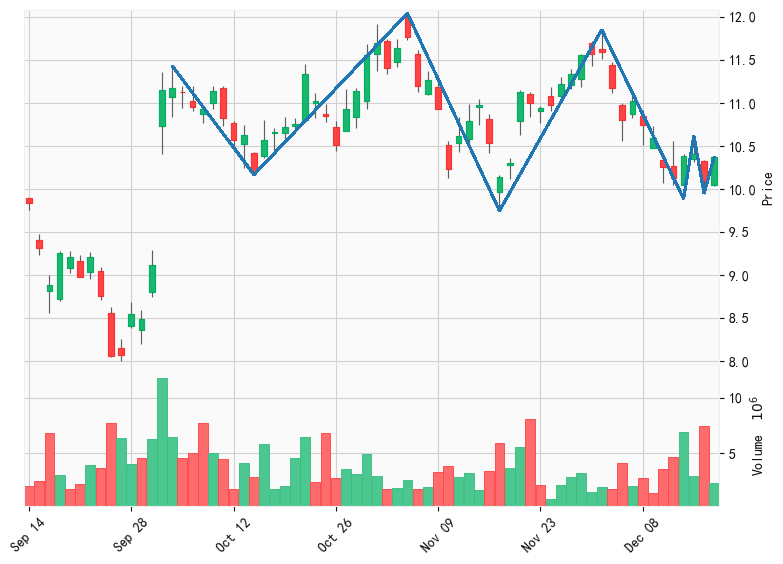
Companhia de Saneamento Basico do Estado de Sao Paulo SABESP(SBS)於2022-12-19日觸發持續菱形(看漲)利好形態。形態回測:近五年,該形態共出現658次,次日上漲概率52.23%,平均漲幅1.98%,盈虧比爲1.25;持倉一月上漲概率59.79%,平均漲幅10.15%,盈虧比爲2.07。
Sendas Distribuidora SA
Sendas Distribuidora SA(ASAI)於2022-12-19日觸發持續菱形(看漲)利好形態。形態回測:近五年,該形態共出現658次,次日上漲概率52.23%,平均漲幅1.98%,盈虧比爲1.25;持倉一月上漲概率59.79%,平均漲幅10.15%,盈虧比爲2.07。

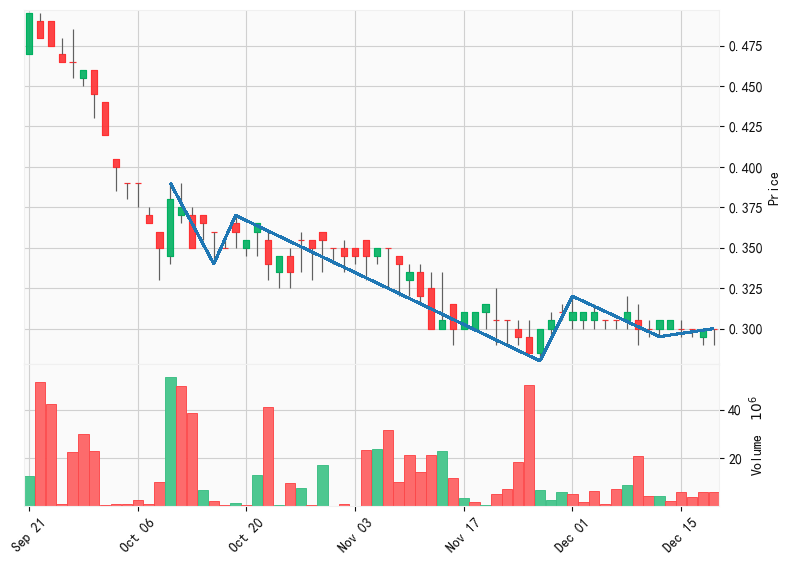
ProSharesl做空FTSE中國50ETF
ProSharesl做空FTSE中國50ETF(YXI)於2022-12-19日觸發持續楔形(看漲)利好形態。形態回測:近五年,該形態共出現443次,次日上漲概率51.24%,平均漲幅2.45%,盈虧比爲1.26;持倉一月上漲概率77.60%,平均漲幅13.57%,盈虧比爲5.56。
Follow us
Find us on
Facebook,
Twitter ,
Instagram, and
YouTube or frequent updates on all things investing.Have a financial topic you would like to discuss? Head over to the
uSMART Community to share your thoughts and insights about the market! Click the picture below to download and explore uSMART app!

Disclaimers
uSmart Securities Limited (“uSmart”) is based on its internal research and public third party information in preparation of this article. Although uSmart uses its best endeavours to ensure the content of this article is accurate, uSmart does not guarantee the accuracy, timeliness or completeness of the information of this article and is not responsible for any views/opinions/comments in this article. Opinions, forecasts and estimations reflect uSmart’s assessment as of the date of this article and are subject to change. uSmart has no obligation to notify you or anyone of any such changes. You must make independent analysis and judgment on any matters involved in this article. uSmart and any directors, officers, employees or agents of uSmart will not be liable for any loss or damage suffered by any person in reliance on any representation or omission in the content of this article. The content of the article is for reference only and does not constitute any offer, solicitation, recommendation, opinion or guarantee of any securities, virtual assets, financial products or instruments. Regulatory authorities may restrict the trading of virtual asset-related ETFs to only investors who meet specified requirements. Any calculations or images in the article are for illustrative purposes only.
Investment involves risks and the value and income from securities may rise or fall. Past performance is not indicative of future performance. Please carefully consider your personal risk tolerance, and consult independent professional advice if necessary.


