小智港股覆盤 | 12月2日
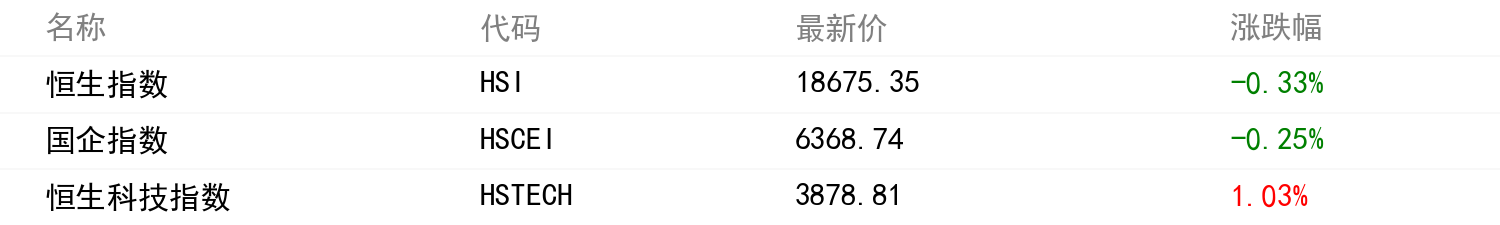
今日,港股三大指數漲跌互現。截止收盤,恆生指數跌0.33%,報18675點。國企指數跌0.25%,報6368點。恆生科技指數漲1.03%,報3878點。市場約709只個股上漲,896只個股下跌。成交額突破1427.75億港幣,和昨天同期相比下跌28.1%。南下資金淨流出12.53億港幣。
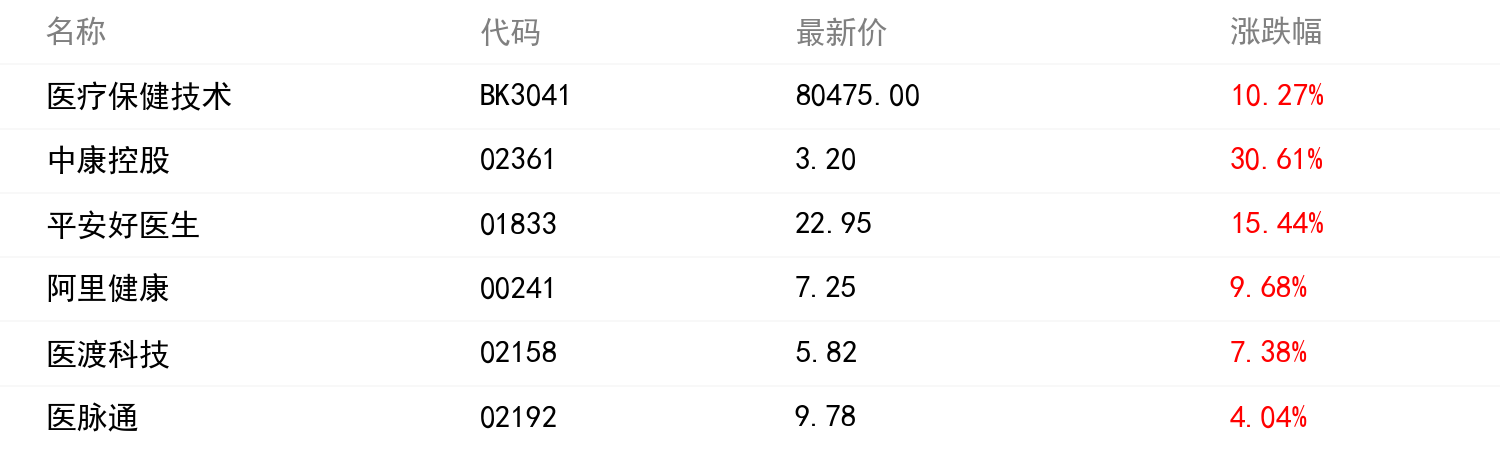
盤面上,互聯網醫療板塊全線走強。中康控股漲超30%;平安好醫生漲超15%;阿裏健康漲超9%;醫渡科技漲超7%;醫脈通漲超4%。平安好醫生漲12%,公司指業務活動連續復甦,大和料其毛利率或勝預期;中金升阿裏健康目標價至6.7元,指中期業績實現扭虧爲盈;醫渡科技中期虧損收窄至3.54億人民幣;高盛削醫脈通目標價10.7%至12.5港元,因疫情復甦下調營收預測。
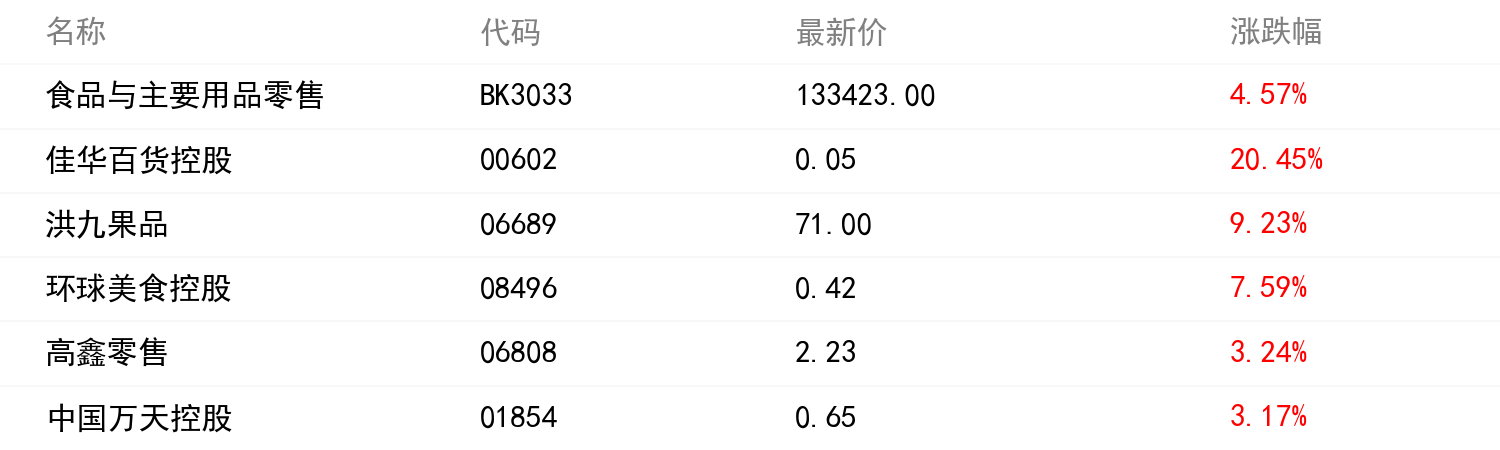
食品零售板塊表現強勁。佳華百貨控股漲超20%;洪九果品漲超9%;環球美食控股漲超7%;高鑫零售、中國萬天控股等多股漲超3%。天風證券首予洪九果品“買入”評級,目標價81.31港元;高鑫零售漲11%,興業指24財年料迎門店2.0加速展店、維持“審慎增持”;中國萬天控股漲9.60%,現報0.69元,創52周新高。
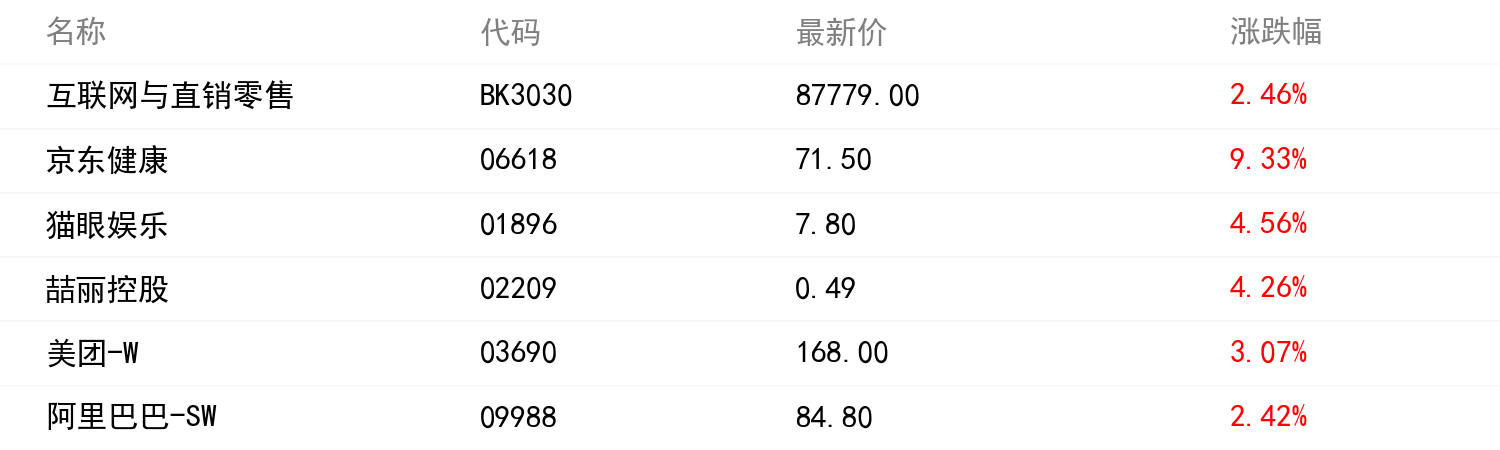
電商板塊走高。京東健康漲超9%;貓眼娛樂、喆麗控股等多股漲超4%;美團-W漲超3%;阿裏巴巴-SW漲超2%。藥品網售監管靴子落地,平安好醫生、京東健康均漲超7%;影視概念股多數上揚,貓眼娛樂漲9.15%;因購股權獲行使,美團-W合計發行10.44萬股。
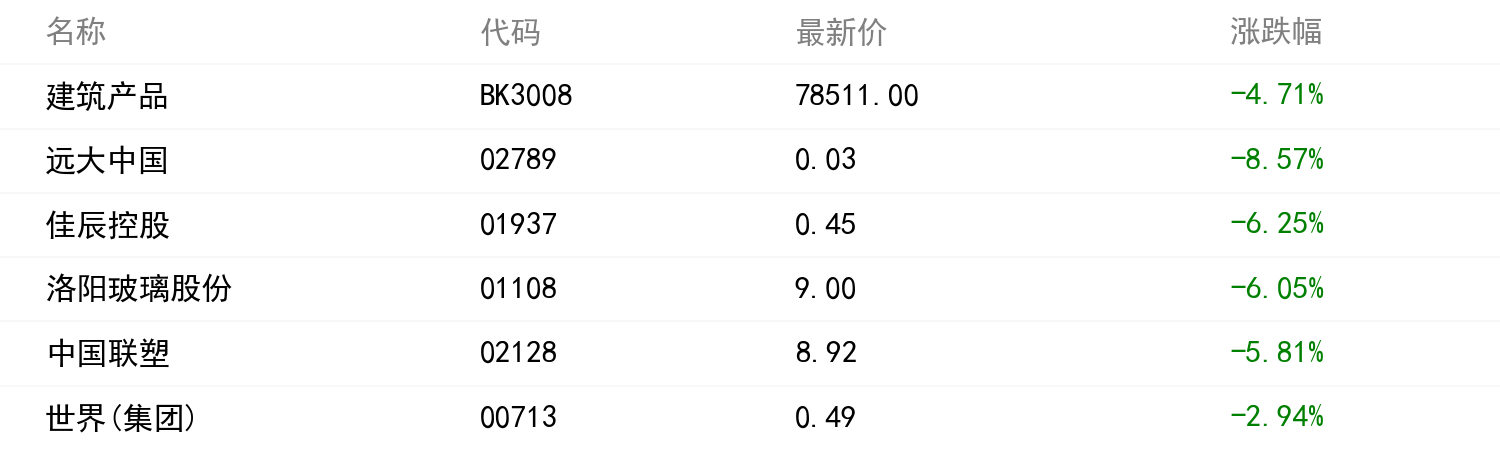
建築建材板塊多數下跌。遠大中國跌超8%;佳辰控股、洛陽玻璃股份等多股跌超6%;中國聯塑跌超5%;世界(集團)跌超2%。
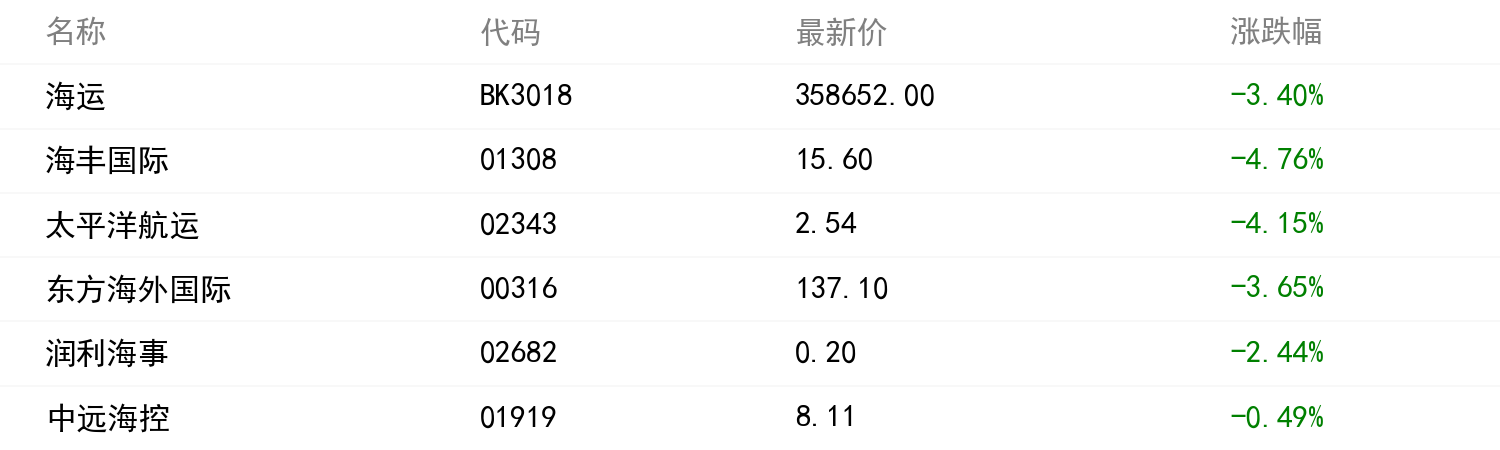
海運板塊跌幅居前。海豐國際、太平洋航運等多股跌超4%;東方海外國際跌超3%;潤利海事跌超2%。海豐國際漲超6%領漲海運股,波羅的海乾散貨運價指數觸及兩週高位;太平洋航運11月30日註銷已回購本金總額爲900萬美元的可換股債券。
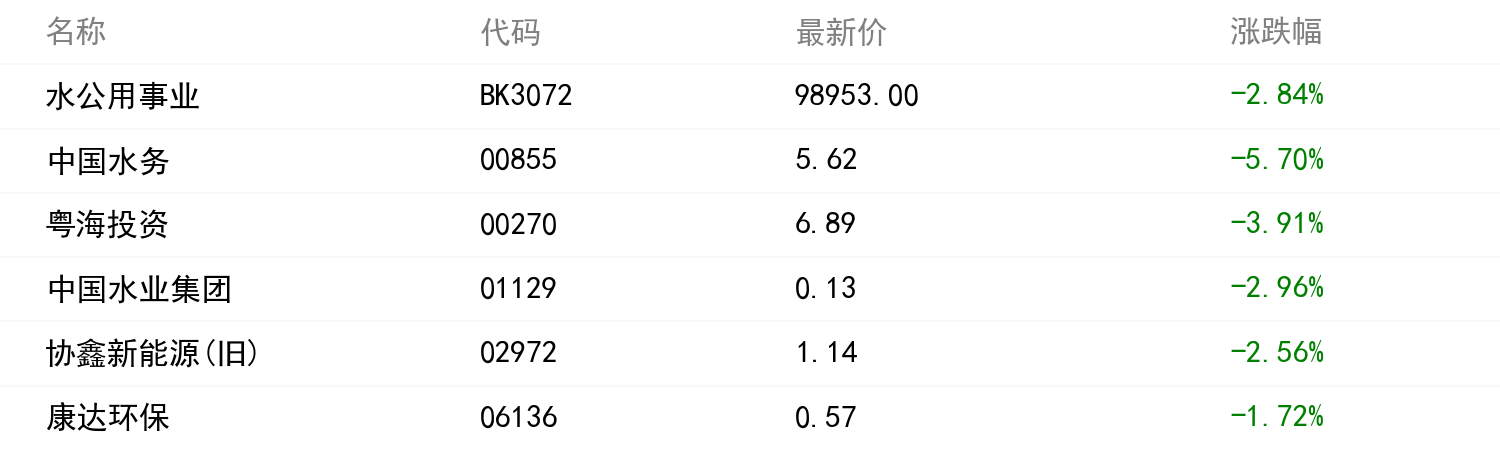
水務板塊走低。中國水務跌超5%;粵海投資跌超3%;中國水業集團、協鑫新能源(舊)等多股跌超2%;康達環保跌超1%。中國水務中期溢利減少4.8%至9.7億元,派中期息16仙。
uSMART智能寫手的信息、數據均來自媒體公開報道,智能寫手不能保證其完全準確,內容僅供參考,不構成投資建議。
Follow us
Find us on
Facebook,
Twitter ,
Instagram, and
YouTube or frequent updates on all things investing.Have a financial topic you would like to discuss? Head over to the
uSMART Community to share your thoughts and insights about the market! Click the picture below to download and explore uSMART app!

Disclaimers
uSmart Securities Limited (“uSmart”) is based on its internal research and public third party information in preparation of this article. Although uSmart uses its best endeavours to ensure the content of this article is accurate, uSmart does not guarantee the accuracy, timeliness or completeness of the information of this article and is not responsible for any views/opinions/comments in this article. Opinions, forecasts and estimations reflect uSmart’s assessment as of the date of this article and are subject to change. uSmart has no obligation to notify you or anyone of any such changes. You must make independent analysis and judgment on any matters involved in this article. uSmart and any directors, officers, employees or agents of uSmart will not be liable for any loss or damage suffered by any person in reliance on any representation or omission in the content of this article. The content of the article is for reference only and does not constitute any offer, solicitation, recommendation, opinion or guarantee of any securities, virtual assets, financial products or instruments. Regulatory authorities may restrict the trading of virtual asset-related ETFs to only investors who meet specified requirements. Any calculations or images in the article are for illustrative purposes only.
Investment involves risks and the value and income from securities may rise or fall. Past performance is not indicative of future performance. Please carefully consider your personal risk tolerance, and consult independent professional advice if necessary.


