


9月26日uSMART交易熱榜 | 道指墜入熊市,空美股熱度高漲;港股現反彈,多空繼續博弈,YANG近一月累漲50%
uSMART盈立智投 09-27 09:24
9月26日uSMART交易熱度排行榜
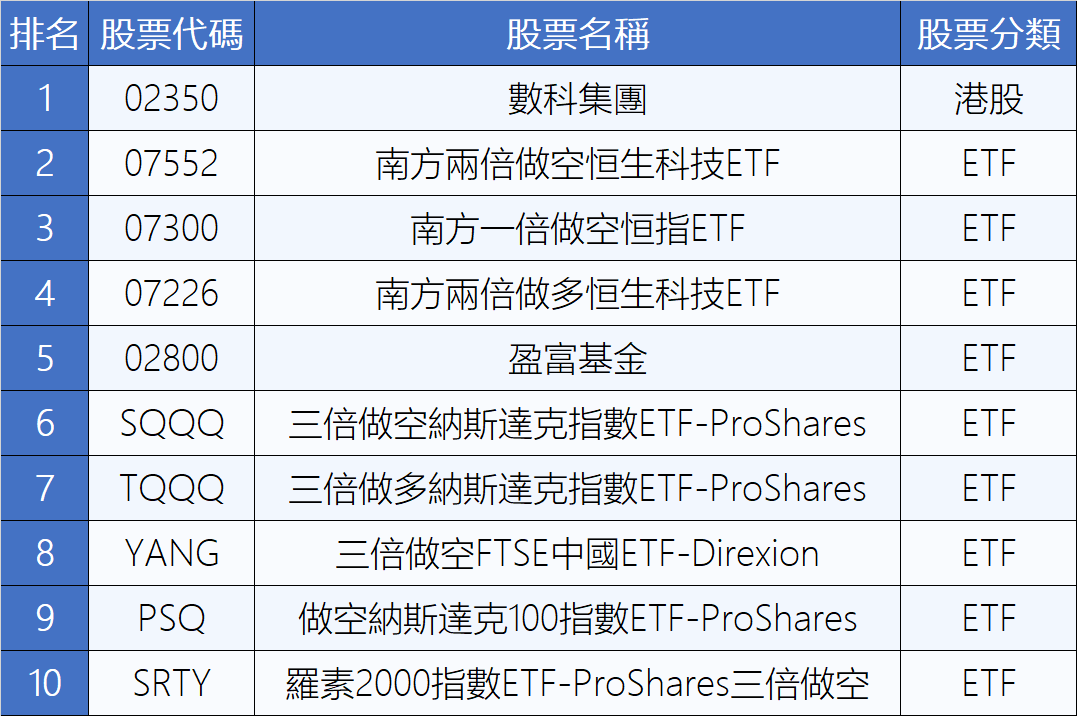
週一(26日),連續下跌的港股早盤現反彈,最終恆指收跌0.44%,恆生科技指數漲1.61%,在恆指刷新近11年低點之際,港股交易熱度超過美股。有投資者入場抄底港股,兩倍做多恆科指ETF(7226)、盈富基金(2800)交易熱度上升至第4、5位。
當然繼續空港股的人數也不在少數,兩倍做空恆科指(7552)、一倍做空恆指(7300)熱度升至第2、3位。三倍做空富時中國50指數ETF(YANG)首次進入榜單,排第8位,富時中國50指數包含在香港上市的市值最大和流動性最好的50只股票。該ETF自8月底低點以來累計上漲近50%。
港股新股的熱度依舊很高,年內“超購王”數科集團首日掛牌,交易人數衝上第1名,不過首日表現卻不如人意,早盤高開後股價持續下挫,最終收跌27%,劇本似乎不對,但原本就是博弈的小票,暗盤和開盤也給了逃生的機會。
美股延續跌勢,連續五個交易日集體收跌,道指較1月初創下的高點下跌了20%,自新冠疫情爆發以來首次跌入熊市。多數做空美股的ETF上榜,除了耳熟能詳的SQQQ,還有一倍做空納指(PSQ)、三倍做空羅素2000(SRTY)。
Follow us
Find us on Facebook, Twitter , Instagram, and YouTube or frequent updates on all things investing.Have a financial topic you would like to discuss? Head over to the uSMART Community to share your thoughts and insights about the market! Click the picture below to download and explore uSMART app!

Disclaimers
uSmart Securities Limited (“uSmart”) is based on its internal research and public third party information in preparation of this article. Although uSmart uses its best endeavours to ensure the content of this article is accurate, uSmart does not guarantee the accuracy, timeliness or completeness of the information of this article and is not responsible for any views/opinions/comments in this article. Opinions, forecasts and estimations reflect uSmart’s assessment as of the date of this article and are subject to change. uSmart has no obligation to notify you or anyone of any such changes. You must make independent analysis and judgment on any matters involved in this article. uSmart and any directors, officers, employees or agents of uSmart will not be liable for any loss or damage suffered by any person in reliance on any representation or omission in the content of this article. The content of the article is for reference only and does not constitute any offer, solicitation, recommendation, opinion or guarantee of any securities, virtual assets, financial products or instruments. Regulatory authorities may restrict the trading of virtual asset-related ETFs to only investors who meet specified requirements. Any calculations or images in the article are for illustrative purposes only.
Investment involves risks and the value and income from securities may rise or fall. Past performance is not indicative of future performance. Please carefully consider your personal risk tolerance, and consult independent professional advice if necessary.

More Content

CS Hotline: +852 3018 4526
Trading days: 24 hours | Non-trading days: 9:00-18:00


