更好的股息選擇:AT&T Vs Verizon
概覽
- AT&T上季度將其2022財年自由現金流預測下調20億美元至140億美元。
- 即使自由現金流的基線估計較低,預期的股息仍能穩定支付。
- 我將根據營收增長、預期自由現金流派息率、估值和收益率對AT&T和Verizon進行比較。
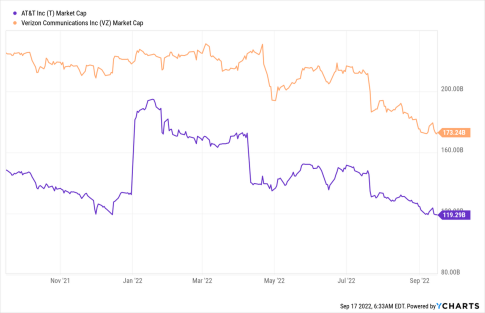
AT&T(紐交所代碼:T)和Verizon (VZ)不僅在各自的運營領域爭奪客戶,還在爭奪購買其中一家公司股票的投資者。AT&T和Verizon都向股東支付誘人的股息,並每年分配相當大一部分自由現金流。然而,隨着AT&T最近將其自由現金流預期下調20億美元,並將自己從內容業務中剝離出來,在本文中我將把這家電信公司與Verizon進行比較,看看哪家公司能給股東帶來更好的交易。我相信兩家公司都對股息投資者有吸引力,但其中一家公司比另一家有優勢!

AT&T和Verizon:對投資者來說,哪支股票的分紅更好?
收入增長疲軟
股票的股息顯然只是投資者關注的一個因素,估值、自由現金流派息率和股息安全性等其他因素也很重要,在決定哪隻股票具有最佳潛力之前,必須考慮這些因素。
我想說的第一點與AT&T和Verizon的收入增長前景有關,兩家電信公司的核心業務都面臨飽和的市場狀況,但它們確實在寬帶業務領域看到了一些增長勢頭。AT&T在22年第二季度的光纖業務淨增31.6萬,而Verizon在第二季度的寬帶業務淨增26.8萬。雖然寬帶業務由於客戶接受速度的加快,對兩家公司都顯示出了一些前景,但AT&T和Verizon的營收都不會有很大的增長。AT&T明年的收入預計將下降2%,而Verizon的收入預計只會同比增長1%。
自由現金流潛力和派息率
AT&T將其自由現金流(“FCF”)指導從160億美元下調至140億美元,因爲客戶面臨越來越大的高通脹壓力和延遲支付賬單。AT&T在22年第二季度的自由現金流是14億美元,這不足以支付其約20億美元的季度股息。根據AT&T目前對2022財年的自由現金流預測,假設第三季度或第四季度的股息或自由現金流預測沒有變化,該電信公司預計2022財年的自由現金流支付率爲57%。
Verizon還沒有給出2022財年的自由現金流預測,但我最近估計,該電信公司今年的自由現金流可能達到170億至190億美元。在22年第二季度,Verizon的自由現金流爲62億美元,輕鬆支付了27億美元的股息。基於對2022財年自由現金流170億美元的最低估計,並假設派息率不變,Verizon今年將支付其估計自由現金流的63%。因此,AT&T在自由現金流支付方面的表現略好於Verizon。
自由現金流估值
基於AT&T 140億美元的自由現金流和Verizon 180億美元的自由現金流,AT&T的P-FCF比爲8.5倍,而Verizon的P-FCF比爲9.6倍。
收益估值
基於自由現金流,AT&T和Verizon的估值都頗具吸引力,但前者略佔優勢。從收益來看,這兩隻股票也都很便宜,AT&T也有些許優勢。
AT&T預計2023財年每股收益爲2.52美元,Verizon預計2023財年每股收益爲5.28美元。AT&T今年每股收益的下降與華納兄弟的分拆有關。基於預期收益,AT&T的市盈率(6.6倍)略低於Verizon(7.8倍)。

產量比較
AT&T從華納兄弟傳媒公司分拆後的年度股息爲每股1.11美元,Verizon爲每股2.61美元。Verizon在第三季度將派息提高了約2%。考慮到兩家電信公司目前的市場價格,AT&T的股息率爲6.6%,Verizon的股息率爲6.3%,AT&T在這方面又有一點優勢。
AT&T、Verizon的風險
由於客戶支付賬單的時間延長,AT&T不得不將其自由現金流預期調整20億美元。隨着近幾個月來消費者價格的持續飆升,更多AT&T(和Verizon)的客戶可能會陷入一種難以按時支付電話費的境地。對於兩家公司來說,這意味着自由現金流風險在2022財年逐漸增加。美國消費者健康狀況的惡化可能導致兩家電信公司的自由現金流和股息支付減少。
最終的想法
儘管自由現金流風險增加,且2022財年的自由現金流預期下調,AT&T似乎是比Verizon更好的選擇:AT&T今年的自由現金流估計可以輕鬆覆蓋該公司的股息。就估值而言,我認爲AT&T也是一筆更好的交易,因爲AT&T的市盈率和本益比均低於Verizon。雖然我同時持有這兩隻股票,但目前的贏家似乎很明顯:AT&T是更好、更安全的派息選擇!
Follow us
Find us on
Facebook,
Twitter ,
Instagram, and
YouTube or frequent updates on all things investing.Have a financial topic you would like to discuss? Head over to the
uSMART Community to share your thoughts and insights about the market! Click the picture below to download and explore uSMART app!

Disclaimers
uSmart Securities Limited (“uSmart”) is based on its internal research and public third party information in preparation of this article. Although uSmart uses its best endeavours to ensure the content of this article is accurate, uSmart does not guarantee the accuracy, timeliness or completeness of the information of this article and is not responsible for any views/opinions/comments in this article. Opinions, forecasts and estimations reflect uSmart’s assessment as of the date of this article and are subject to change. uSmart has no obligation to notify you or anyone of any such changes. You must make independent analysis and judgment on any matters involved in this article. uSmart and any directors, officers, employees or agents of uSmart will not be liable for any loss or damage suffered by any person in reliance on any representation or omission in the content of this article. The content of the article is for reference only and does not constitute any offer, solicitation, recommendation, opinion or guarantee of any securities, virtual assets, financial products or instruments. Regulatory authorities may restrict the trading of virtual asset-related ETFs to only investors who meet specified requirements. Any calculations or images in the article are for illustrative purposes only.
Investment involves risks and the value and income from securities may rise or fall. Past performance is not indicative of future performance. Please carefully consider your personal risk tolerance, and consult independent professional advice if necessary.


