FBCV:價值競賽的領導者
總結
- FBCV是一種面向大中型公司的積極管理型價值ETF。
- 優點:它比通常的價值型ETF更“聰明”,而且從一開始就打敗了它們。
- 缺點:它是一個黑匣子,歷史很短,流動性很弱。

FBCV策略和投資組合
The Fidelity Blue Chip Value ETF (BATS:FBCV)是一隻積極管理的ETF,於2020年2月6日推出,它的12個月派息收益率爲3.47%,總費用比率爲0.59%,淨資產約爲1.14億美元。它每季度支付一次。正如富達在招股說明書中描述的那樣,該基金不同於傳統的ETF:
不需要在每個營業日公開披露其完整的投資組合持有情況。相反,該基金在其網站上每個工作日都發佈一個“跟蹤籃子”(Tracking Basket),旨在密切跟蹤該基金的日常表現,但不是該基金的實際投資組合。
FBCV投資於“FMR認爲在資產,銷售,收益,增長潛力或現金流等因素方面在市場上被低估的公司,或與同一行業內其他公司的證券相關的公司”。
投資組合的週轉率相當高:最近一個財政年度的週轉率爲97%。
FBCV的基準是羅素1000價值指數。在本文中,它將與iShares Russell 1000 Value ETF(IWD),以及SPDR S&P 500 Trust ETF (SPY)進行比較。通常的估值比率見下表。
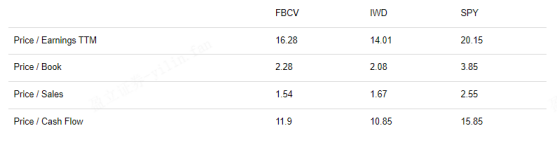
除了價格/銷量,FBCV在4個比例上比SPY便宜,比IWD稍微貴一點。
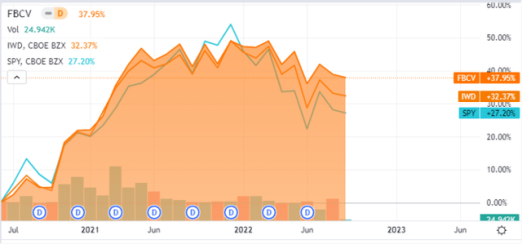
自2020年6月成立以來,FBCV的表現分別比IWD和SPY高出5.6和10.7個百分點(見下表),這是不含股息的股價表現。
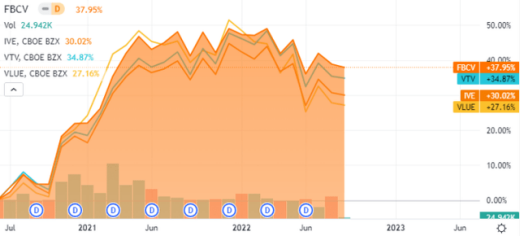
下圖比較了FBCV與另外三支由不同發行機構根據不同標的指數發行的大中型價值ETF,FBCV仍然處於領先地位。
爲什麼FBCV更好?價值指數通常根據相同的標準對所有股票進行排名,這意味着估值比率在各個行業之間被認爲具有可比性。但顯然他們不是,其結果是對估值比率自然較低的行業(尤其是金融類股)給予優待,FBCV的招股書中沒有透露太多關於該戰略的信息,但披露了公司與同行業的比較情況,跨所有部門和行業的偏見可能無法完全消除,但至少它減少了。
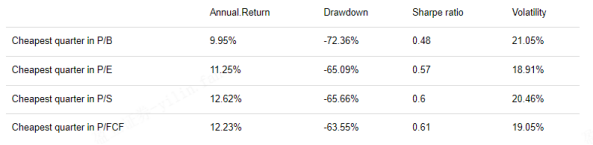
價值指數的另一個缺點是將市淨率(P/B)作爲主要因素。在概率方面,相對於市盈率(P/E)、市銷率(P/S)和P/FCF較低的相同規模的公司含有更高比例的價值陷阱。從統計數據上看,這一羣體的波動性也會更高,價格降幅也會更大。下表顯示了標普500指數中最便宜的一個季度(即125只股票)的回報和風險指標,以市淨率(P/B)、市盈率(P/E)、市銷率(P/S)和P/FCF來衡量。從1999年1月1日到2022年1月1日,這些集合每年重新組成,元素的權重相等。
FBCV可能會使用類似的比率,包括與P/B密切相關的比率。然而,它也使用了“增長潛力”標準,它可能是PEG比率,或者使用每股收益增長或銷售增長估計的其他指標。無論如何,它通過降低選擇價值陷阱的風險,使FBCV優於通常的價值指數ETF。
FBCV是一隻大中型股的積極管理型價值ETF,它缺乏傳統ETF的透明度:其策略和持股情況不由富達披露,此外,其資產價值和平均交易量較低,儘管存在這些缺陷,但與其他大型價值ETF相比,它可能是一個有吸引力的選擇。在過去的兩年裏,它擊敗了主要的競爭對手和標普500指數,並實現了一個考慮到行業和增長的智能價值概念。
Follow us
Find us on
Facebook,
Twitter ,
Instagram, and
YouTube or frequent updates on all things investing.Have a financial topic you would like to discuss? Head over to the
uSMART Community to share your thoughts and insights about the market! Click the picture below to download and explore uSMART app!

Disclaimers
uSmart Securities Limited (“uSmart”) is based on its internal research and public third party information in preparation of this article. Although uSmart uses its best endeavours to ensure the content of this article is accurate, uSmart does not guarantee the accuracy, timeliness or completeness of the information of this article and is not responsible for any views/opinions/comments in this article. Opinions, forecasts and estimations reflect uSmart’s assessment as of the date of this article and are subject to change. uSmart has no obligation to notify you or anyone of any such changes. You must make independent analysis and judgment on any matters involved in this article. uSmart and any directors, officers, employees or agents of uSmart will not be liable for any loss or damage suffered by any person in reliance on any representation or omission in the content of this article. The content of the article is for reference only and does not constitute any offer, solicitation, recommendation, opinion or guarantee of any securities, virtual assets, financial products or instruments. Regulatory authorities may restrict the trading of virtual asset-related ETFs to only investors who meet specified requirements. Any calculations or images in the article are for illustrative purposes only.
Investment involves risks and the value and income from securities may rise or fall. Past performance is not indicative of future performance. Please carefully consider your personal risk tolerance, and consult independent professional advice if necessary.


