


基金週報:全球股市震盪
uSMART盈立智投 06-13 15:15
全球市場週迴顧
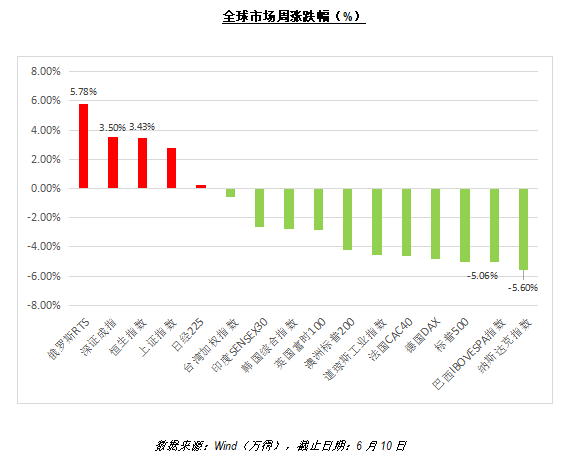
上週,全球大多數股票市場下跌,漲、跌幅最大的爲俄羅斯RTS和納斯達克,分別上漲了5.78%和下跌了5.60%。排在後兩名的是深證成指和恆生指數,分別上漲3.50%和3.43%。
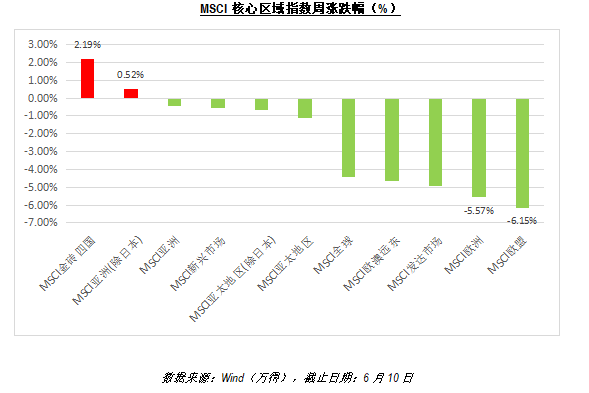
MSCI核心區域指數多數下跌,其中漲幅最大的爲MSCI金磚四國和MSCI亞洲出日本,分別2.19%和0.52%。跌幅最大的是MSCI歐盟和MSCI歐洲,分別損失了6.15%和5.57%。
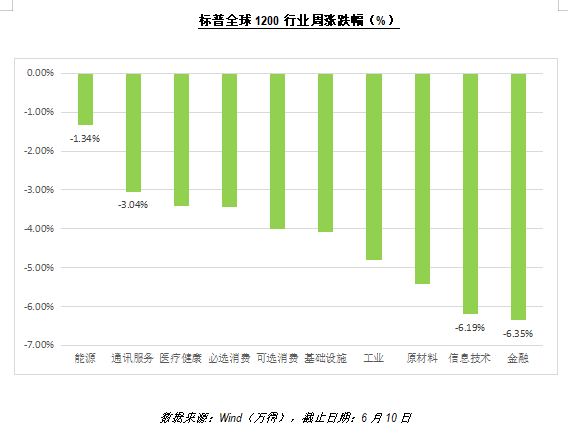
標普全球1200行業全部下跌,跌幅最大的行業爲金融和信息技術,分別下跌6.35%和6.19%。
恆生港股行業漲跌不一,漲幅最大的是資訊科技業和醫療保健業,錄得12.16%和10.93%的收益。跌幅最大的是綜合企業和公用事業,分別下跌2.85%和2.16%.

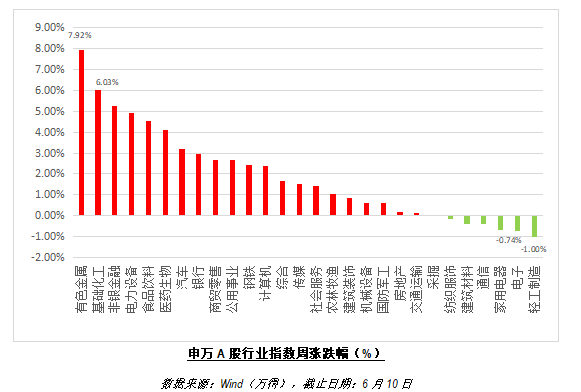
大部分申萬一級行業上漲,漲幅最大的是有色金屬和基礎化工,漲幅分別爲7.92%和6.03%。跌幅最大的是輕工製造和電子,各自下跌了1.00%和0.74%。
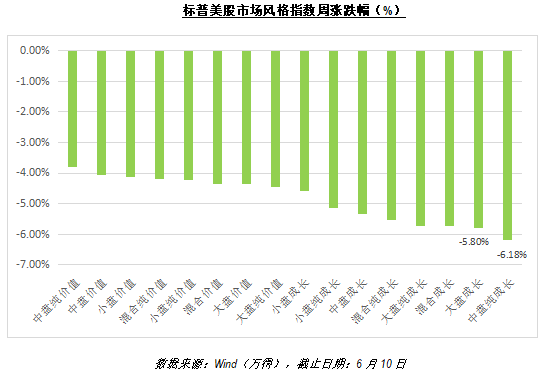
標普美股市場風格指數全部下跌,跌幅最大的是中盤純成長和大盤成長,分別下跌6.18%和5.80%。
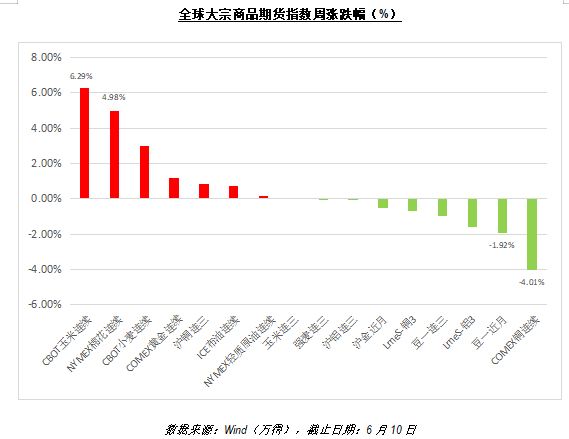
全球大宗商品期貨多數下跌,其中漲幅最大的是CBOT玉米連續和NYMEX棉花連續,分別漲了6.29%和4.98%。跌幅最大的是COMEX銅連續和豆一近月,損失分別爲4.01%和1.92%。
全球基金投資者動態
全球ETF最大淨流入的前兩個國家是美國和加拿大,而中國和韓國成爲全球最大淨流出的前兩名。
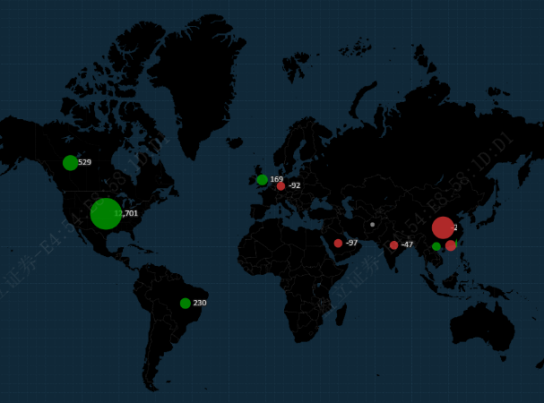
數據來源:Bloomberg(彭博),截止日期:6月13日
Follow us
Find us on Facebook, Twitter , Instagram, and YouTube or frequent updates on all things investing.Have a financial topic you would like to discuss? Head over to the uSMART Community to share your thoughts and insights about the market! Click the picture below to download and explore uSMART app!

Disclaimers
uSmart Securities Limited (“uSmart”) is based on its internal research and public third party information in preparation of this article. Although uSmart uses its best endeavours to ensure the content of this article is accurate, uSmart does not guarantee the accuracy, timeliness or completeness of the information of this article and is not responsible for any views/opinions/comments in this article. Opinions, forecasts and estimations reflect uSmart’s assessment as of the date of this article and are subject to change. uSmart has no obligation to notify you or anyone of any such changes. You must make independent analysis and judgment on any matters involved in this article. uSmart and any directors, officers, employees or agents of uSmart will not be liable for any loss or damage suffered by any person in reliance on any representation or omission in the content of this article. The content of the article is for reference only and does not constitute any offer, solicitation, recommendation, opinion or guarantee of any securities, virtual assets, financial products or instruments. Regulatory authorities may restrict the trading of virtual asset-related ETFs to only investors who meet specified requirements. Any calculations or images in the article are for illustrative purposes only.
Investment involves risks and the value and income from securities may rise or fall. Past performance is not indicative of future performance. Please carefully consider your personal risk tolerance, and consult independent professional advice if necessary.

More Content

CS Hotline: +852 3018 4526
Trading days: 24 hours | Non-trading days: 9:00-18:00


