維峯電子創業板IPO,專注工業控制連接器,比亞迪為客户
近日,創業板上市委發佈公吿,維峯電子(廣東)股份有限公司(以下簡稱”維峯電子“)將於4月8日首發上會,申萬宏源證券為其保薦機構。
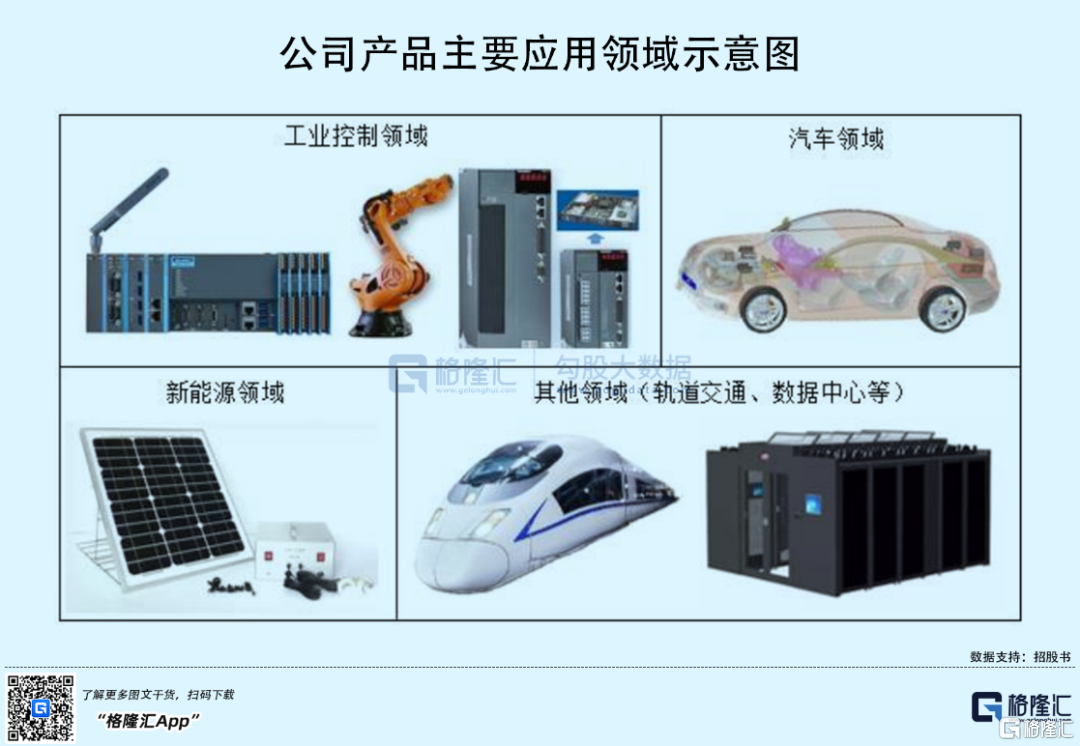
維峯電子主要從事工業控制連接器、汽車連接器及新能源連接器的研發、設計、生產和銷售,公司產品主要應用於工業控制與自動化設備、新能源汽車“三電”系統、光伏逆變系統等系列應用場景。
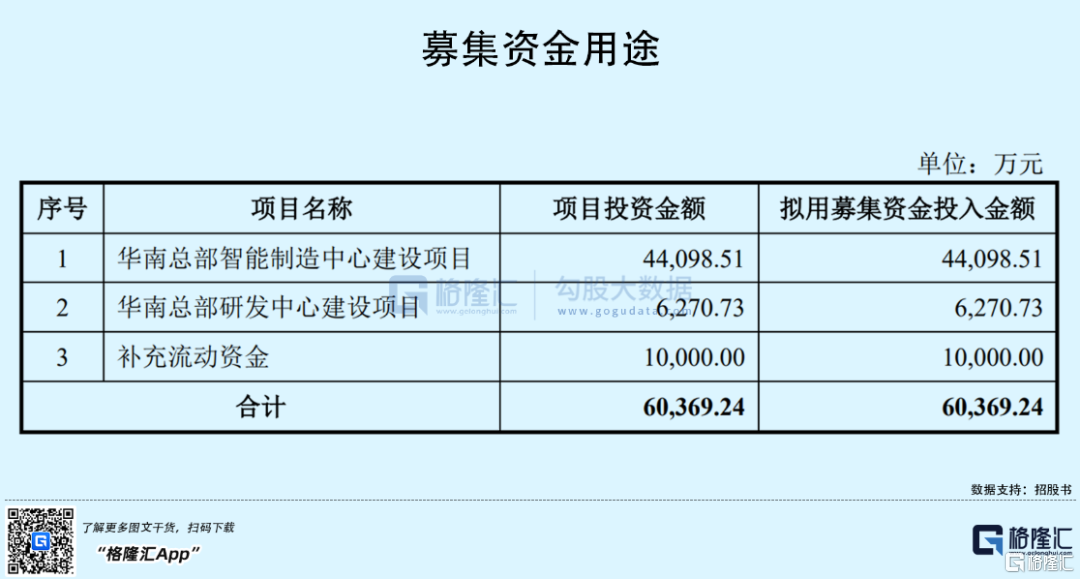
公司本次擬募資約6億元,用於華南總部智能製造中心建設項目、華南總部研發中心建設項目以及補充流動資金。
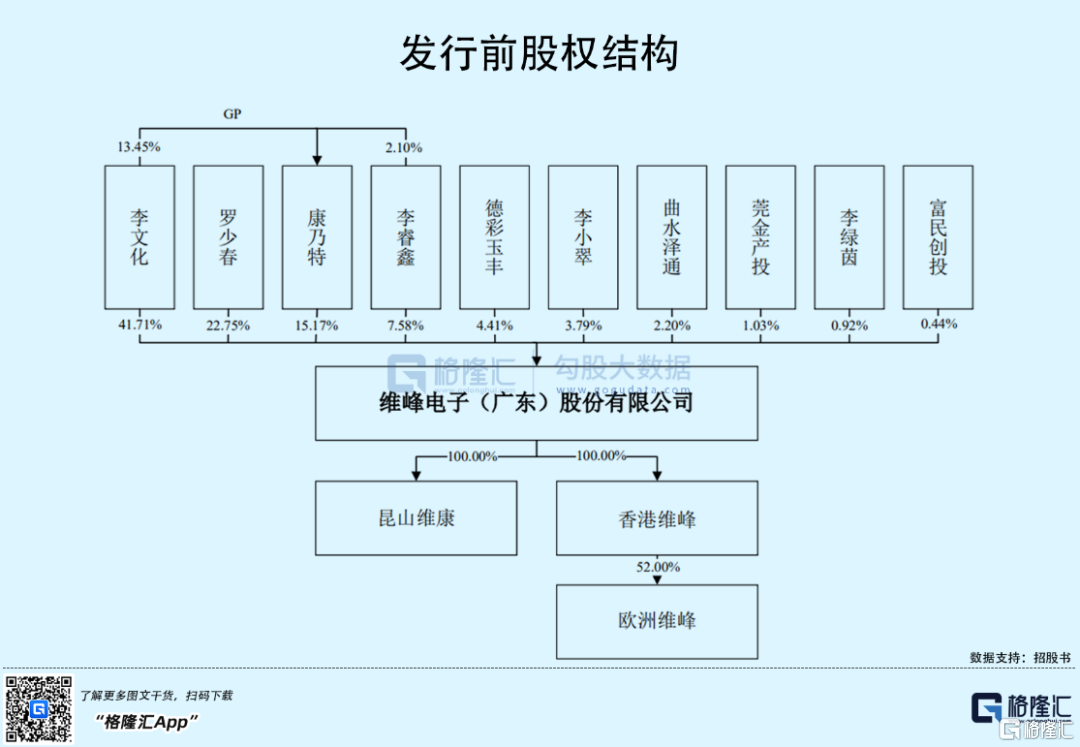
截至發行前,維峯電子的控股股東為李文化,其直接持有公司41.71%的股份,通過康乃特間接控制公司15.17%的股份;李文化之妻羅少春直接持有公司22.75%的股份;李文化之子李睿鑫直接持有公司7.58%的股份,三人合計直接或間接控制公司87.21%的股份,為公司的共同實際控制人。
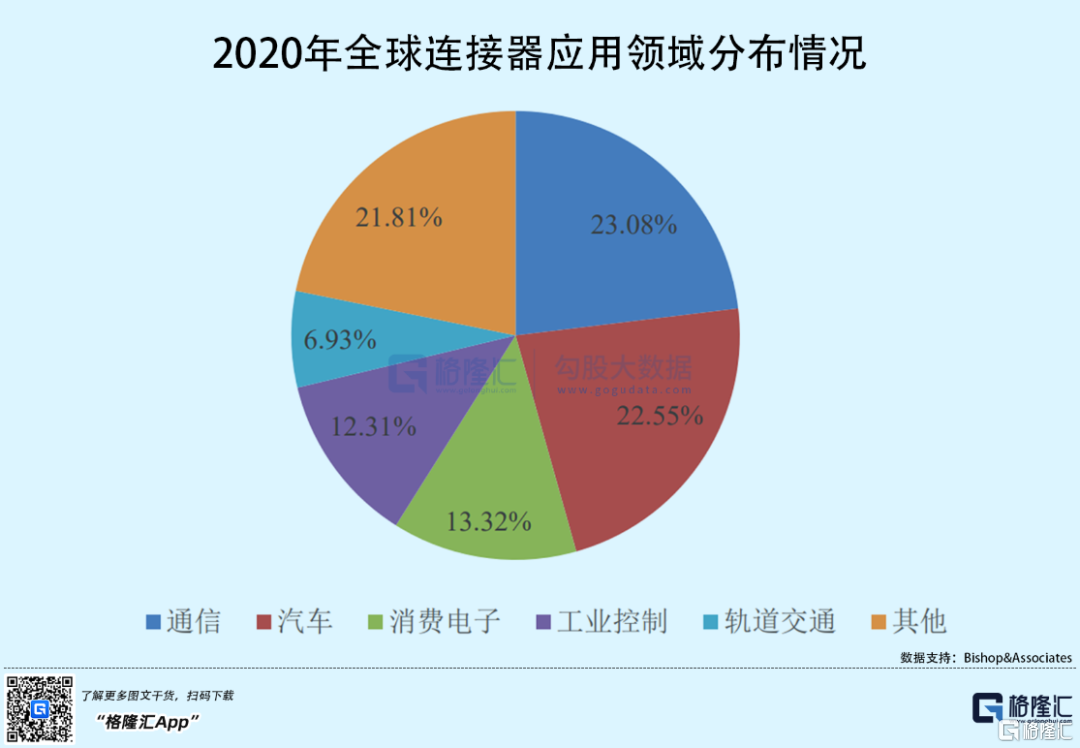
維峯電子所處細分行業為電子元器件行業中的連接器子行業,從應用領域分佈來看,通信、汽車、消費電子、工業控制、軌道交通是連接器最主要的應用領域,2020年佔比分別為23.08%、22.55%、13.32%、12.31%以及6.93%,合計達78.19%。
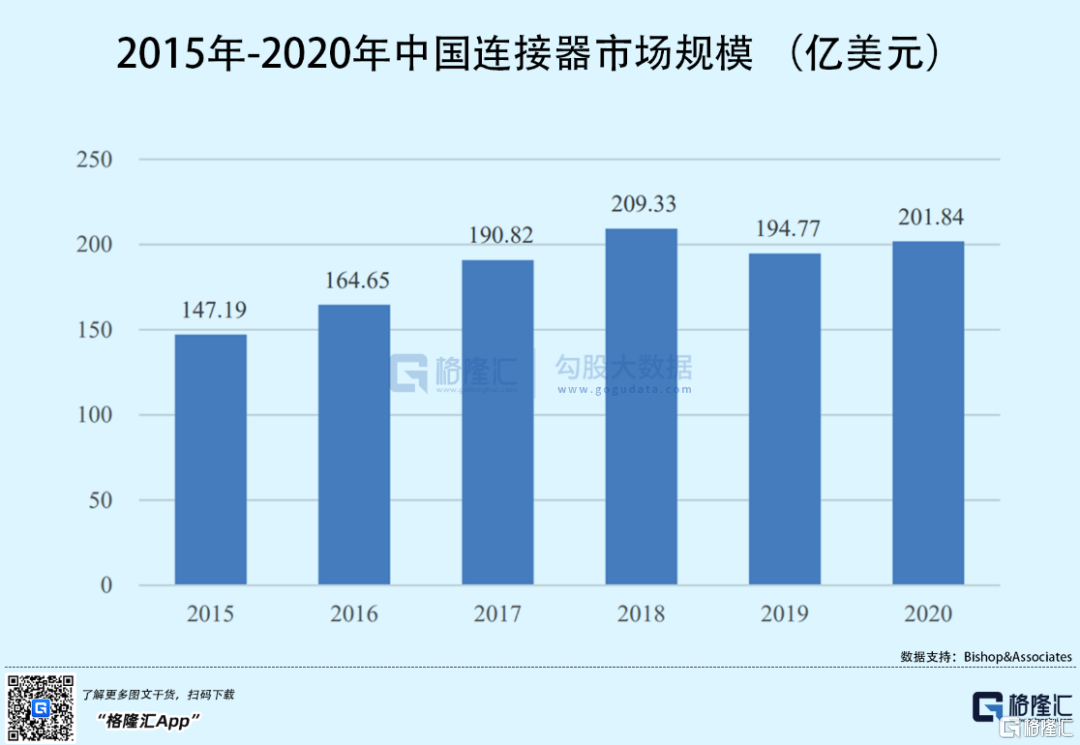
目前中國是全球最大的連接器市場,2020年中國連接器市場份額佔全球比例達到32.18%。據統計,中國連接器市場規模從2015年的147.19億美元增長至2018年的209.33億美元,而2019年有所下滑,2020年市場規模為201.84億美元。
由於下游市場對配套電子元器件的要求不斷提升,具有較強實力的國際一流廠商競爭優勢較為突出,致使全球連接器市場集中度越來越高。世界前十大連接器企業市場份額佔比從1995年的41.60%增長至2019年的61.44%。
而國內主要以中低端產品居多,並且市場集中度也在快速提升。中國前五大連接器企業市場份額佔比從2010年的5.15%增長至2018年的42.77%。
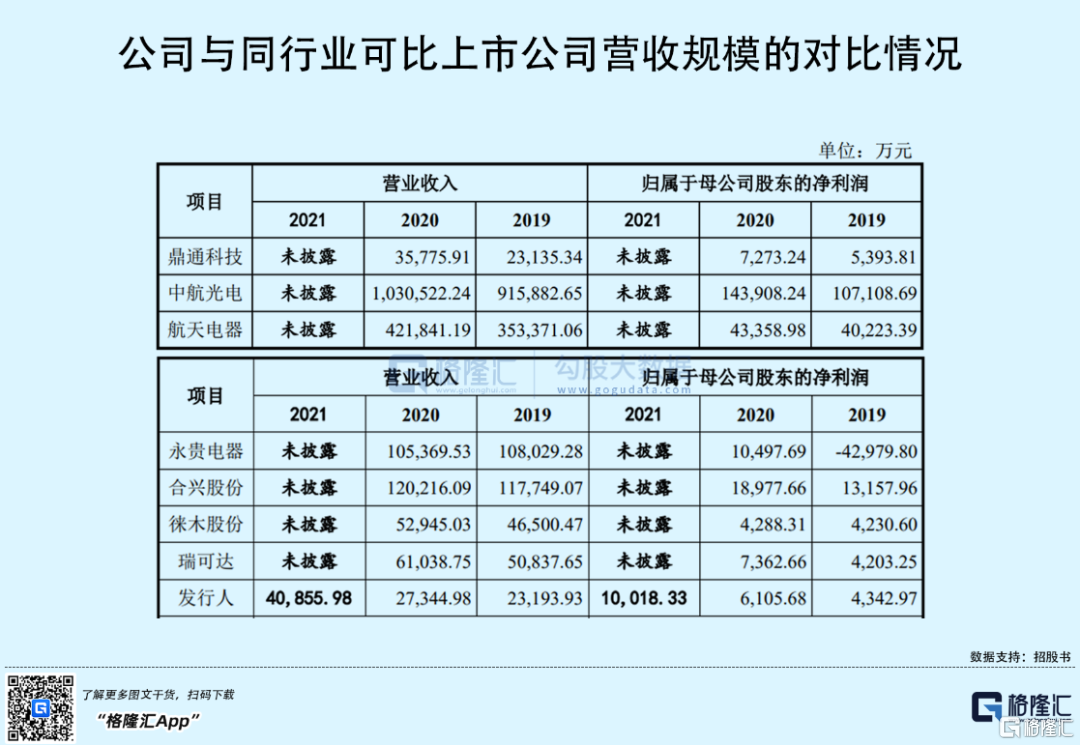
與國際知名企業相比,維峯電子在經營規模、市場佔有率等方面存在較大差距;在A股可比上市公司中,公司的營收規模也略顯弱勢。
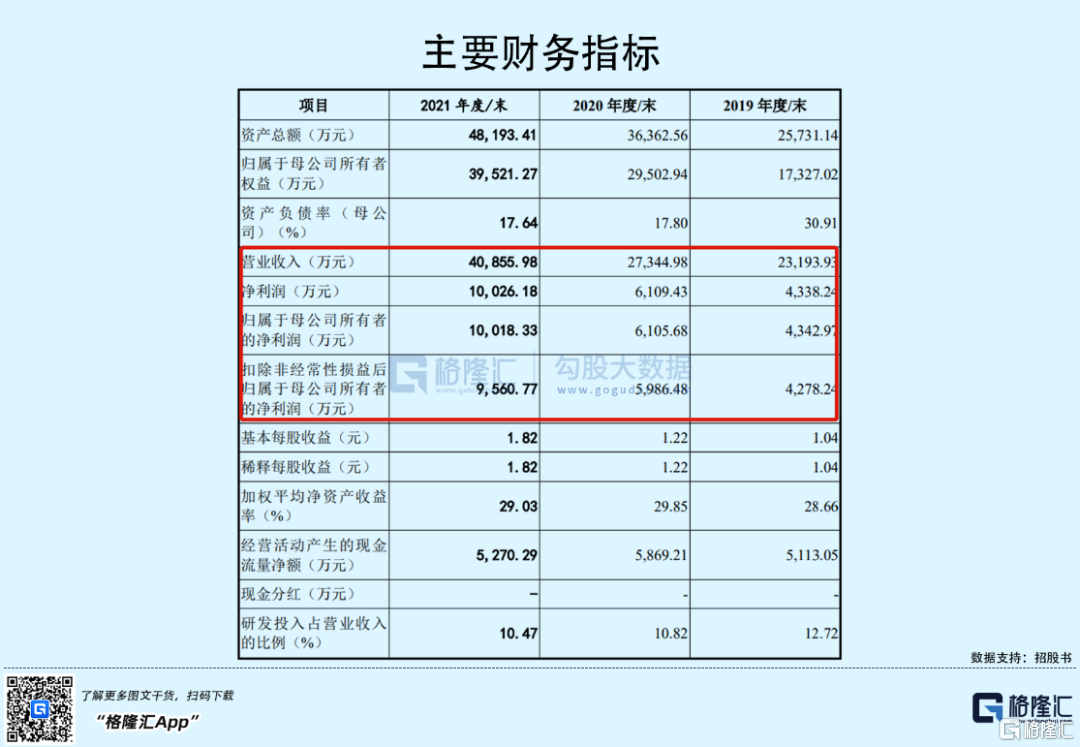
業績方面,2019年至2021年各報吿期,維峯電子分別實現營收2.32億元、2.73億元和4.09億元,歸母淨利潤分別為4342.97萬元、6105.68萬元和1.0億元,公司的營收和淨利潤均呈現上升態勢。
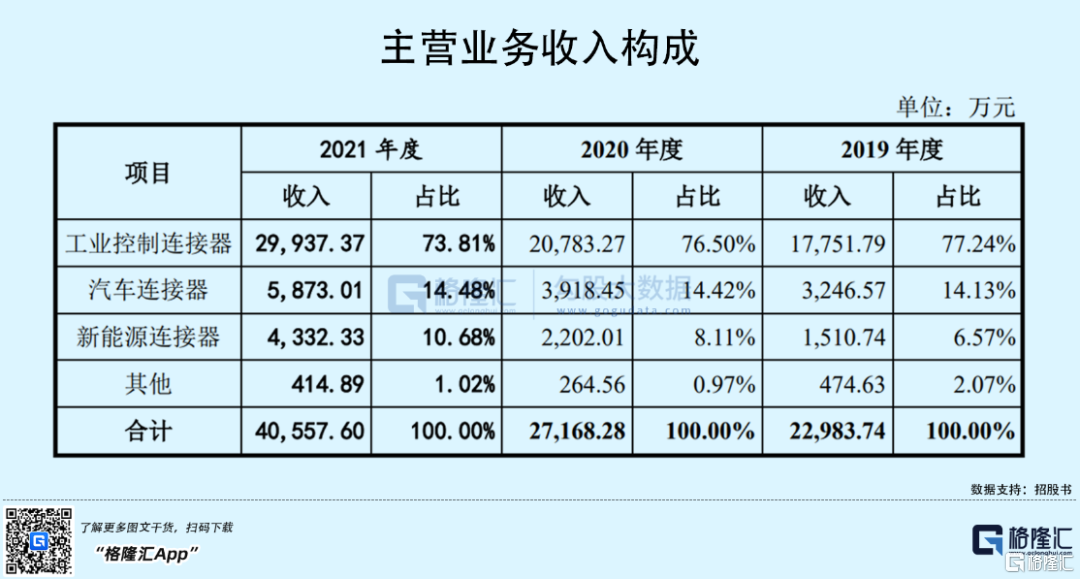
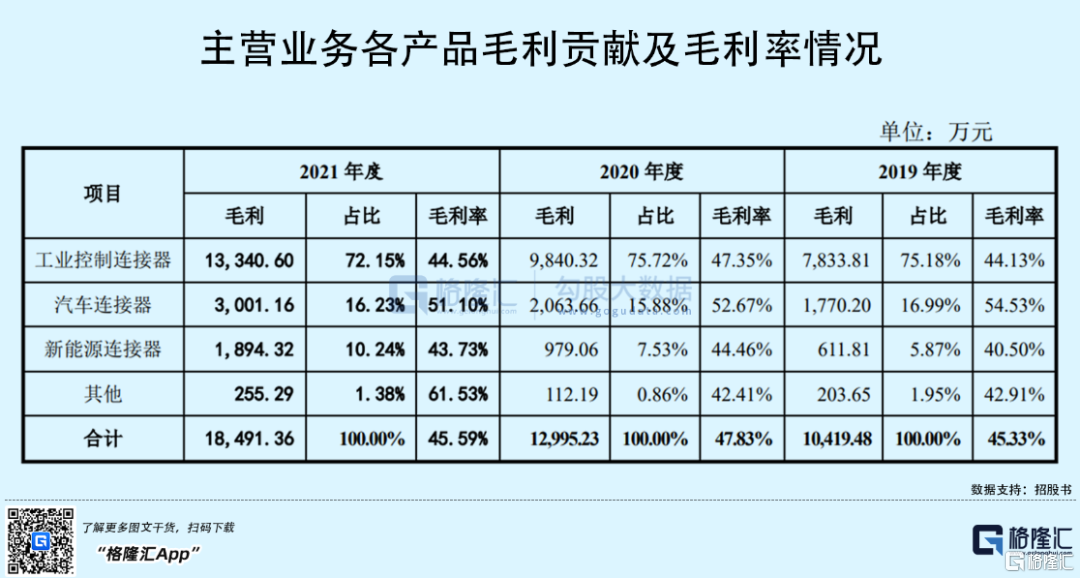
從營收的產品分類構成看,報吿期各期工業控制連接器產品的銷售收入佔比均在70%以上,是公司營收的主要構成部分。
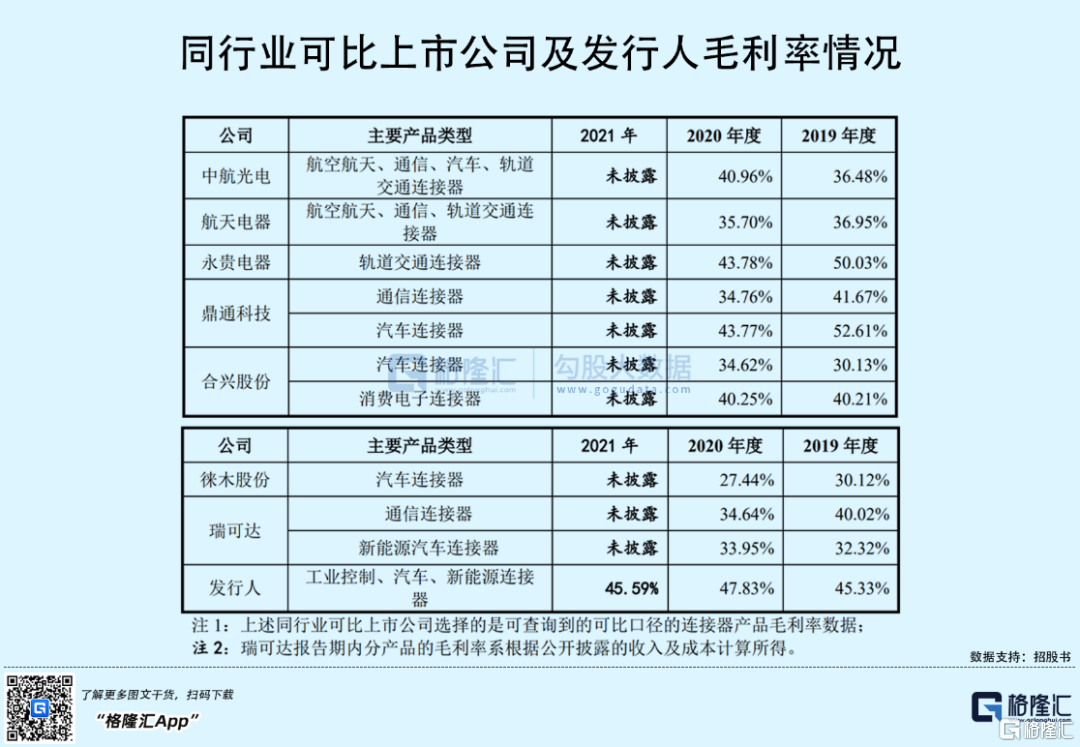
近三年來,維峯電子各類產品毛利率水平略有波動,呈現先升後降的態勢,整體略高於同行業可比公司水平,報吿期各期,公司主營業務毛利率分別為45.33%、47.83%和45.59%。
其中,公司汽車連接器毛利率相比其他產品較高,達到50%以上,主要是由於公司從新能源汽車切入,以“三電系統”為代表的核心產品定位較高,毛利也相對較高;且新能源汽車高端連接器產品的進口替代屬性較突出,公司進入了以比亞迪為代表的大型車廠直供體系,製造優勢和成本優勢得以體現。
一般來説,在規模越大、國產化程度越高的市場,產品競爭越激烈,毛利率相對較低。目前國內以連接器為主業的上市公司較多,未來不排除由於下游市場規模增速放緩,市場競爭加劇,導致公司產品價格面臨下行壓力,進而採取調價策略應對競爭的可能,公司毛利率或將存在下降的風險。
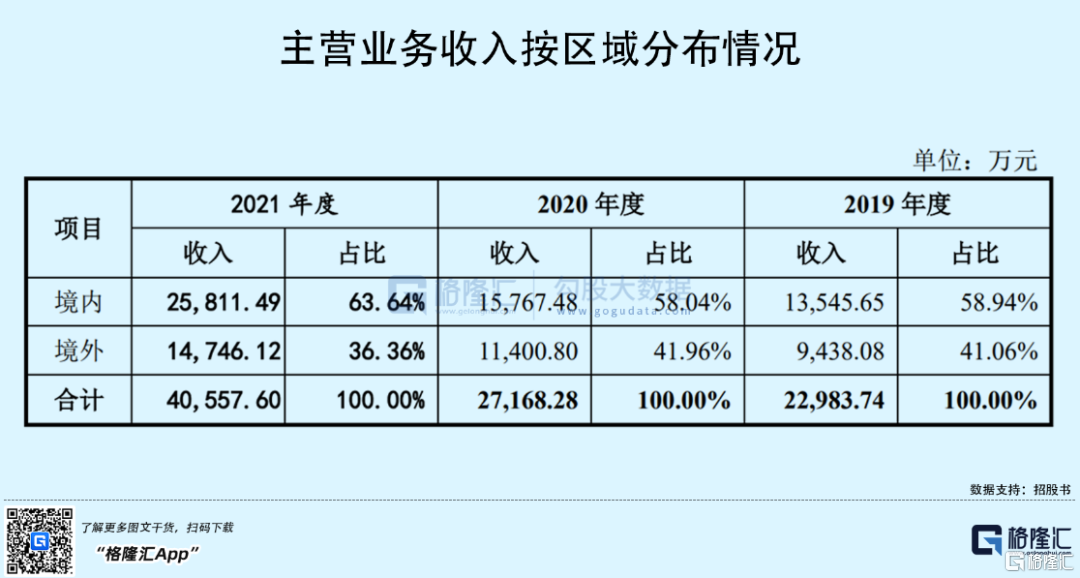
另外,按地區分類來看,維峯電子兼有內銷和外銷,其中境內客户主要有匯川技術、比亞迪和開合電子等,境外客户主要有泰科電子、香港克琛達、Würth 集團等。
報吿期內,公司的境外銷售收入分別為9438.08萬元、1.14億元和1.47億元,佔公司主營業務收入的比例分別為41.06%、41.96%和36.36%。由於連接器行業的貿易環境及政策容易受到國際經濟政治形式的影響,未來可能存在一定的政策變化風險及匯率波動風險。
結語
目前,維峯電子主要採取差異化的策略與國際一流廠商進行競爭,但公司當前規模仍不大,不利於公司實現較好的規模經濟。隨着行業競爭的日益激烈,公司亟需在保證技術先進的基礎上擴大整體規模,從而提高綜合競爭力。
Follow us
Find us on
Facebook,
Twitter ,
Instagram, and
YouTube or frequent updates on all things investing.Have a financial topic you would like to discuss? Head over to the
uSMART Community to share your thoughts and insights about the market! Click the picture below to download and explore uSMART app!

Disclaimers
uSmart Securities Limited (“uSmart”) is based on its internal research and public third party information in preparation of this article. Although uSmart uses its best endeavours to ensure the content of this article is accurate, uSmart does not guarantee the accuracy, timeliness or completeness of the information of this article and is not responsible for any views/opinions/comments in this article. Opinions, forecasts and estimations reflect uSmart’s assessment as of the date of this article and are subject to change. uSmart has no obligation to notify you or anyone of any such changes. You must make independent analysis and judgment on any matters involved in this article. uSmart and any directors, officers, employees or agents of uSmart will not be liable for any loss or damage suffered by any person in reliance on any representation or omission in the content of this article. The content of the article is for reference only and does not constitute any offer, solicitation, recommendation, opinion or guarantee of any securities, virtual assets, financial products or instruments. Regulatory authorities may restrict the trading of virtual asset-related ETFs to only investors who meet specified requirements. Any calculations or images in the article are for illustrative purposes only.
Investment involves risks and the value and income from securities may rise or fall. Past performance is not indicative of future performance. Please carefully consider your personal risk tolerance, and consult independent professional advice if necessary.


