可川科技滬市主板IPO,聚焦功能性器件,依賴內銷業務
近日,上海證券交易所上市委員會收到蘇州可川電子科技股份有限公司(以下簡稱“可川科技”)申報稿預披露更新申請,中信證券為其保薦機構。可川科技本次擬募集資金6.05億元,擬發行股數不超過1,720萬股,佔發行後總股本的比例不低於25%。
根據招股書顯示,朱春華和施惠慶合計直接持有公司4,790萬股,合計直接持股比例為92.83%,朱春華和施惠慶是公司的控股股東、共同實際控制人。
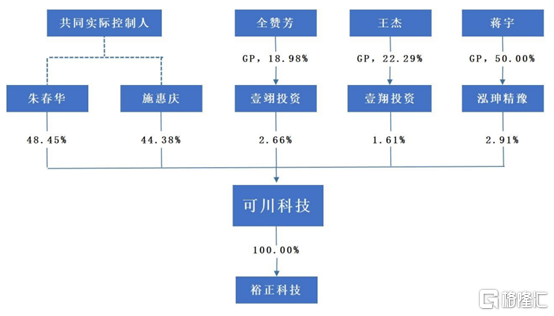
公司股權結構,圖源,招股書
1
主營業務毛利率低於同行
公司主營業務為功能性器件的設計、研發、生產和銷售。電池類功能性器件業務方面,公司聚焦於消費電子電池和新能源動力電池兩大細分領域;結構類功能性器件業務方面,公司專注於筆記本電腦結構件模組領域;光學類功能性器件業務方面,公司產品主要為擴散片、防爆膜、遮光膠帶等。
2018年至2021上半年,可川科技營業收入分別為4.01億元、4.79億元、5.60億元和3.25億元,扣非後歸母淨利潤分別為7543.63萬元、8147.67萬元、8699.17萬元和4574.69萬元,營業收入和淨利潤增長主要原因是電池類功能性器件和結構類功能性器件收入的快速增長。
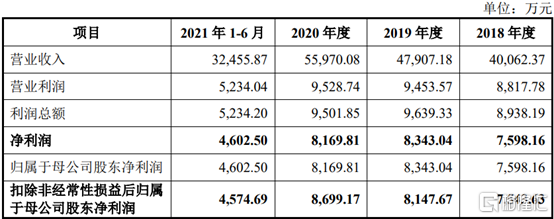
2018年至2021上半年公司主要核心財務,圖源,招股書
報吿期內,公司主營業務毛利率分別為34.91%、31.29%、29.14%和26.26%,主營業務毛利率逐年下降,主要原因是收入佔比較高的電池類功能性器件毛利率下滑,進而導致電池類功能性器件整體毛利率有所降低。此外,毛利率較低的結構類功能性器件業務收入佔比有所提升,從而拉低公司整體主營業務毛利率。
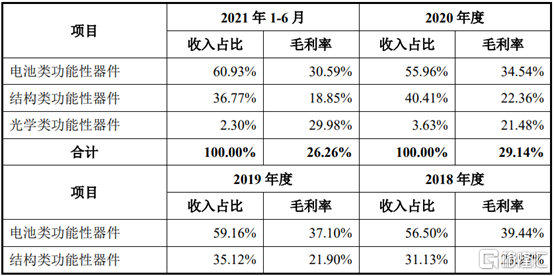
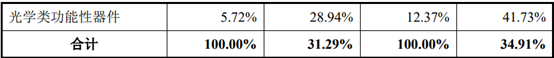
2018年至2021上半年公司主營業務毛利率,圖源,招股書
報吿期內,同行業可比公司主營業務毛利率分別為39.99%、40.54%、38.20%和34.55%,公司主營業務毛利率低於同行業可比公司。
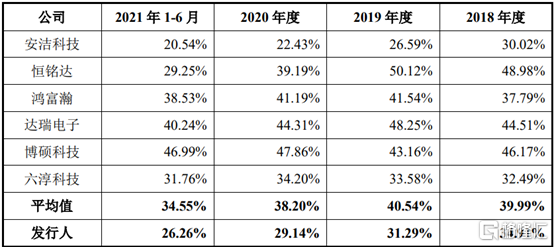
2018年至2021上半年公司主營業務毛利率與同行業可比公司對比,圖源,招股書
2
依賴內銷業務
報吿期內,公司主營業務收入主要來源於內銷業務,內銷銷售金額分別為3.56億元、4.05億元、4.66億元和2.72億元,內銷銷售金額佔主營業務收入比例分別為89.23%、84.81%、83.47%和84.03%,內銷佔比逐年下降,但公司內銷銷售金額卻呈逐年上升趨勢,主要原因是內銷客户ATL及寧德時代採購需求增長所帶動。
公司境外地區銷售主要以保税區銷售為主,保税區銷售金額佔主營業務收入比例分別為9.06%、13.22%、14.50%和14.61%,佔比有所上升,主要系保税區客户聯寶電子採購需求增長所致。
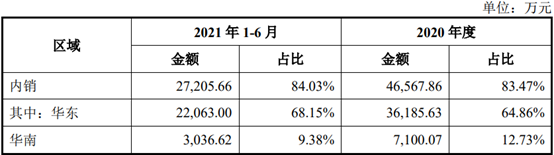
2018年至2021上半年公司主營業務收入分地域情況,圖源,招股書
3
前五大客户銷售佔比逐年提高
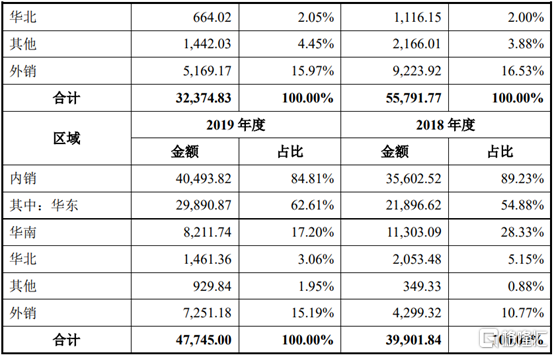
報吿期內,公司產品主要應用於消費電子產品和新能源汽車的相關組件中,公司客户包括ATL、LG化學、聯寶電子、春秋電子、寧德時代等消費電子和新能源汽車產業鏈相關製造服務商、組件生產商。公司前五大客户的合計銷售收入分別為1.75億元、2.90億元、3.60億元和2.18億元,佔主營業務收入的比重分別為43.86%、60.73%、64.45%和67.31%,客户集中度較高,主要原因是下游品牌集中度較高、客户對供應鏈集中管控等因素,產業鏈呈現集中化的特徵。
公司對聯寶電子及其配套的組件生產商的銷售收入佔主營業務收入的比重分別為31.10%、34.89%、39.85%和36.32%。未來,若現有主要客户採購需求出現明顯下滑,或客户經營情況和資信狀況發生重大不利變化,則可能會對公司的生產銷售帶來不利影響。
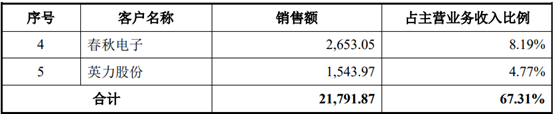
2021上半年公司向前五大客户銷售情況,圖源,招股書
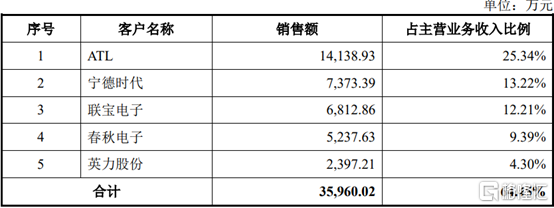
2020年公司向前五大客户銷售情況,圖源,招股書
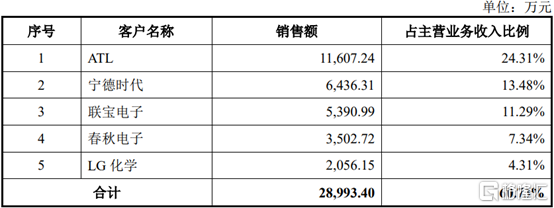
2019年公司向前五大客户銷售情況,圖源,招股書
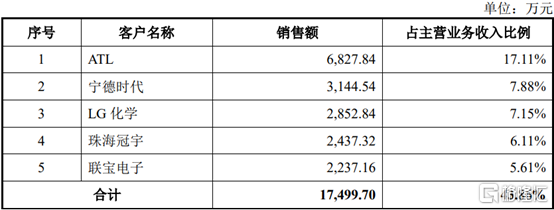
2018年公司向前五大客户銷售情況,圖源,招股書
4
小結
在物聯網、5G和新能源電池等技術的不斷髮展和普及的推動下,功能性器件已經成為消費電子行業和新能源汽車行業的重要輔助角色。可川科技聚焦消費電子和新能源汽車兩大領域,需要加強研發力度,提高研發產出效率,增強生產技術水平,將技術優勢轉化成為產品優勢和客户優勢,從而提升產品市場佔有率和自身在功能性器件行業中的影響力。
Follow us
Find us on
Facebook,
Twitter ,
Instagram, and
YouTube or frequent updates on all things investing.Have a financial topic you would like to discuss? Head over to the
uSMART Community to share your thoughts and insights about the market! Click the picture below to download and explore uSMART app!

Disclaimers
uSmart Securities Limited (“uSmart”) is based on its internal research and public third party information in preparation of this article. Although uSmart uses its best endeavours to ensure the content of this article is accurate, uSmart does not guarantee the accuracy, timeliness or completeness of the information of this article and is not responsible for any views/opinions/comments in this article. Opinions, forecasts and estimations reflect uSmart’s assessment as of the date of this article and are subject to change. uSmart has no obligation to notify you or anyone of any such changes. You must make independent analysis and judgment on any matters involved in this article. uSmart and any directors, officers, employees or agents of uSmart will not be liable for any loss or damage suffered by any person in reliance on any representation or omission in the content of this article. The content of the article is for reference only and does not constitute any offer, solicitation, recommendation, opinion or guarantee of any securities, virtual assets, financial products or instruments. Regulatory authorities may restrict the trading of virtual asset-related ETFs to only investors who meet specified requirements. Any calculations or images in the article are for illustrative purposes only.
Investment involves risks and the value and income from securities may rise or fall. Past performance is not indicative of future performance. Please carefully consider your personal risk tolerance, and consult independent professional advice if necessary.


