You are browsing the Hong Kong website, Regulated by Hong Kong SFC (CE number: BJA907). Investment is risky and you must be cautious when entering the market.
油價反轉,最值得抄底排行榜!

本文來自格隆匯專欄:君臨,作者:君臨研究中心

最近兩週,美國加息落地、中概股兩地談判有積極進展、房地產調控鬆綁、歐洲新能源需求超預期,好消息着實不少。

雖然指數上仍然在底部附近,但各板塊困境反轉的勢頭已經明朗化。

目前這個位置,也正是調倉換股、低位佈局的好時候。

今天重點跟大家分析一下,各板塊在油價下降的過程中,受益程度分別是多少。

1

油價對經濟的影響,傳導過程是這樣的——

1)下游企業生產成本上升,利潤率和產能利用率下降;

2)企業對前景存在擔憂,收縮投資;

3)員工收入下降,並且面臨商品漲價的雙重打擊,減少支出;

4)市場萎縮,企業進一步裁員過冬;

這是個螺旋式下降的負反饋循環,油價通過各個環節的傳導,對企業的成本和需求都形成了抑制,由此進一步導致了業績和股價的雙殺。

根據業內的研究,油價每上漲 1%將影響製造業投資 0.35%左右,並帶來實際私人消費下滑約 0.06%。

對應到GDP,油價上漲1%將拖累中國實際 GDP 增速約 0.03%。

如果今年國際油價中樞 90 美元/桶,相比 2019 年(沒有疫情,油價中樞 60 美元/桶)的情形,將影響 GDP 增速約1.4%。

2019年我國GDP增速是6%,下降1.4%,就是4.6%,這個比例已經是相當大,實際上目前的油價還在100美元以上,所以今年一季度的GDP增速應該是最困難的。

要達成今年政府定下來的5.5%目標增速,勢必要拿出更大的救市措施才行。

這也是我們認為下半年股市值得樂觀的重要原因。

2

具體到各行業來看,油價對業績的影響嚴重程度大小取決於行業的原油消耗強度和價格傳導能力。

原油消耗強度可以用油氣完全消耗係數代表,即生產 1 單位產品需要投入的油氣量(包括直接消耗和間接消耗)。

價格傳導能力則可以用各行業 PPI 與石油價格的相關性來衡量。

一般來説,原油消耗強度較高,價格傳導能力又比較弱的,在油價上漲的過程中最受傷。

但相反,一旦油價退燒,它們的業績彈性也是最強的。

下面是一張券商整理的各行業完全消耗指數表,即各行業的成本跟油價相關性的排名,數據越高,成本壓力越大。

表:製造業行業對油氣的完全消耗係數

資料來源:國家統計局,天風證券研究所

從上表可見,油價上漲對原材料製造業的成本衝擊最大。

其中消耗係數超 3%的細分行業有17個,大幅超過消費品的5個細分行業和裝備的3個行業。

主要的細分板塊包括:石化、化纖與合成材料、化肥農藥、塑料、日化、服裝、玻璃、建材石膏、電池、電纜等。

3

下面進一步考察價格傳導能力。

這張是製造業各行業 PPI 與石油價格的相關性列表——

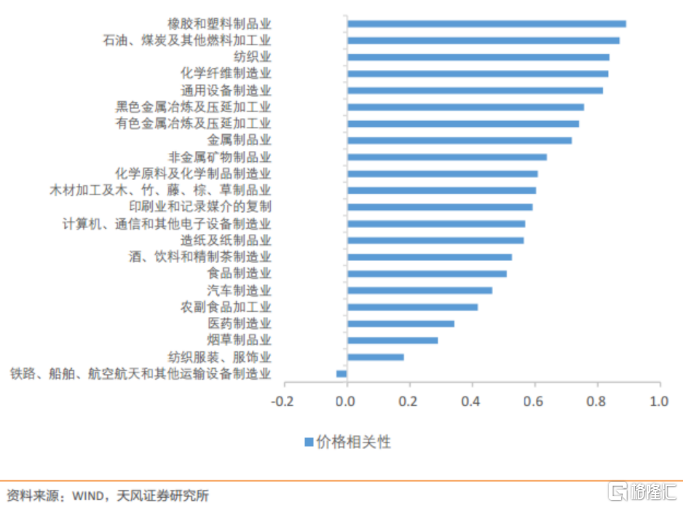
可以看到,原材料相關的中上游行業的成本壓力雖然大,但傳導能力也是比較強的。

近一年來股市的行業分化也印證了這個邏輯,石化、冶金、農業等板塊在油價上漲的過程中,股價同樣表現不俗。

相對來説,靠近應用端的中下游行業在價格傳導能力上偏弱,理論上更受益於油價的下跌。

4

結合原油消耗強度+價格傳導能力綜合評估,君臨認為當下最值得關注的三個細分板塊是——

(1)原材料類:建材

代表個股:海螺水泥、江山歐派、三棵樹、東方雨虹、北新建材

(2)消費品類:家電

代表個股:美的集團、海爾智家、科沃斯、石頭科技

(3)裝備類:電池

代表個股:寧德時代、億緯鋰能、恩捷股份、珠海冠宇

Follow us
Find us on Facebook, Twitter , Instagram, and YouTube or frequent updates on all things investing.Have a financial topic you would like to discuss? Head over to the uSMART Community to share your thoughts and insights about the market! Click the picture below to download and explore uSMART app!
Disclaimers
uSmart Securities Limited (“uSmart”) is based on its internal research and public third party information in preparation of this article. Although uSmart uses its best endeavours to ensure the content of this article is accurate, uSmart does not guarantee the accuracy, timeliness or completeness of the information of this article and is not responsible for any views/opinions/comments in this article. Opinions, forecasts and estimations reflect uSmart’s assessment as of the date of this article and are subject to change. uSmart has no obligation to notify you or anyone of any such changes. You must make independent analysis and judgment on any matters involved in this article. uSmart and any directors, officers, employees or agents of uSmart will not be liable for any loss or damage suffered by any person in reliance on any representation or omission in the content of this article. The content of the article is for reference only and does not constitute any offer, solicitation, recommendation, opinion or guarantee of any securities, virtual assets, financial products or instruments. Regulatory authorities may restrict the trading of virtual asset-related ETFs to only investors who meet specified requirements. Any calculations or images in the article are for illustrative purposes only.
Investment involves risks and the value and income from securities may rise or fall. Past performance is not indicative of future performance. Please carefully consider your personal risk tolerance, and consult independent professional advice if necessary.
uSMART
Wealth Growth Made Easy
Open Account