覆盤巴菲特清倉基金
本文來自格隆匯專欄作家:海榕財富風險投研
在1969年的5月,巴菲特39歲,在給股東的信中巴菲特稱,“通過定量分析能找到的投資機會,現在幾乎找不到了” ,準備解散清算基金。
巴菲特當時明確指出,股市已到達奢侈的頂部,自己找不到任何可投資的品種。實際上,在1968年致股東的信中,巴菲特已經罕見的表示,今年我們獲得的收益率為 58.8%,創造了新的記錄 ,但這種投資收益率有一定的運氣成,當年道瓊斯指數僅為 7.7%,

(巴菲特合夥人基金早期收益率)
在1967年致股東的信中,巴菲特説:合夥人基金整體上漲 35.9%,道指上漲 19.0%,近距離觀察一下 1967 年的股市,就會冷靜下來。或許歷史上沒有哪一年像去年這樣,市場中有那麼多人遠遠跑贏道指。1967 年,對於許多人來説,天上掉金子了,盆越大的接的越多。現在我手裏還沒有最終的統計數據,但是估計 95% 以上的股票型基金都取得了領先道指的業績,很多甚至把道指遠遠甩在了後面。去年賺錢多少和年齡大小成反比,理念像我這樣的,得被送到老年病房了。
巴菲特清倉的主要原因還是估值太貴了 ,在1965年左右美股市場就開始追求“漂亮50”的公司了,從1965年算起,1965.01-1969.12,漂亮50上漲 230%,標普500上漲 9%。巴菲特在此之前曾重倉美國運通,1964-1966年,巴菲特的伯克希爾將40%的資金陸續買入漂亮50中的美國運通,總成本為1300萬美元,到了1967年該筆投資升值為2800萬美元,之後在1969年之前陸續賣出,總收益率約2倍多。
在巴菲特清倉之後,漂亮50的公司又上漲了3年,漂亮50上漲113%,標普500上漲37%,這期間估計巴菲特又承受了巨大的壓力,1972年通常認為的漂亮50高光時刻,漂亮50已經進入了“市夢率”階段,龍頭股寶麗來達到了 90 倍,麥當勞 85 倍,迪斯尼 82 倍,而同期標普 500 平均的市盈率為 33 倍,從1973年開始 ,漂亮50開始下跌。
1973年的春夏兩季,巴菲特重新投下1060萬美元,收購了華盛頓郵報12%的B股股份,一舉成為該報的第二大股東,買入的估值是6倍PE,1倍PB, ROE 18%,當時華盛頓郵報 還是小盤股。但收購完成後,美股繼續下跌,他的持股市值也從1973年的1060萬美元下降到1974年底的800萬美元,到1976年一直都低於他的收購成本。之後華盛頓郵報開始逐步企穩,這筆投資從1000萬美元增長最高超過10億美元,投資回報率超過100倍。
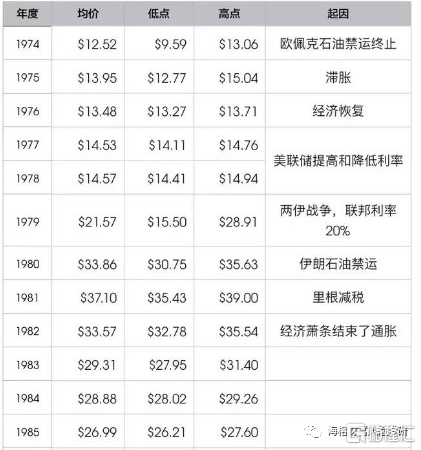
在巴菲特重新建倉後,從1973年到1983年的十年中,“漂亮50”的估值從43倍大幅回落到不到10倍,正常情況下估值不會跌這麼多,運氣比較差,主要原因是全球原油價大漲,美債收益率從6%飆升到14%。要補充的一點是,當前利率環境與美國70年代不是一個量級水平。70年代,10年期美債利率在10%上下,而當前美債利率在2.0%上下,國內10年期國債利率也僅在3.2%上下。那麼,對於A股核心資產來説,隨着利率回升,殺估值幅度自然也不會如美國70年代“漂亮50”幅度那麼大。
“漂亮50”崩盤後,從1975年開始,美股市場風格發生重大變化,轉變成為以成長股為特徵的中小盤股票行情,小盤股行情持續到1985年才結束。在這些中小盤股票中,如果有高成長性,會受到更大程度的熱捧。另一方面,高成長的股票,和第三次工業革命有關,以微電子技術、信息技術、新材料技術,生物技術等發展為代表,產生了英特爾、惠普、微軟、蘋果和甲骨文等一批高科技企業。而這些企業,在當時,就是小企業。
Follow us
Find us on
Facebook,
Twitter ,
Instagram, and
YouTube or frequent updates on all things investing.Have a financial topic you would like to discuss? Head over to the
uSMART Community to share your thoughts and insights about the market! Click the picture below to download and explore uSMART app!

Disclaimers
uSmart Securities Limited (“uSmart”) is based on its internal research and public third party information in preparation of this article. Although uSmart uses its best endeavours to ensure the content of this article is accurate, uSmart does not guarantee the accuracy, timeliness or completeness of the information of this article and is not responsible for any views/opinions/comments in this article. Opinions, forecasts and estimations reflect uSmart’s assessment as of the date of this article and are subject to change. uSmart has no obligation to notify you or anyone of any such changes. You must make independent analysis and judgment on any matters involved in this article. uSmart and any directors, officers, employees or agents of uSmart will not be liable for any loss or damage suffered by any person in reliance on any representation or omission in the content of this article. The content of the article is for reference only and does not constitute any offer, solicitation, recommendation, opinion or guarantee of any securities, virtual assets, financial products or instruments. Regulatory authorities may restrict the trading of virtual asset-related ETFs to only investors who meet specified requirements. Any calculations or images in the article are for illustrative purposes only.
Investment involves risks and the value and income from securities may rise or fall. Past performance is not indicative of future performance. Please carefully consider your personal risk tolerance, and consult independent professional advice if necessary.


