


港股暴力大反彈!恆生科技指數漲逾6%,科技股全線暴動,京東、B站等大漲逾12%
格隆匯 03-16 10:21
港股終於止住了!
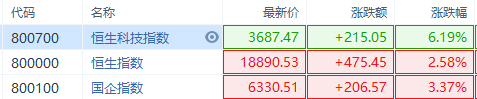
3月16日,港股一改前幾日下跌頹勢,迎來暴力大反彈。截止發稿,恆生科技指數漲超6%,恆指漲超2%,國企指數漲超3%。
科技股也迎來全線暴動。京東、嗶哩嗶哩、攜程均漲逾12%,網易、快手、美團、騰訊、阿里、百度、小米等紛紛大漲。

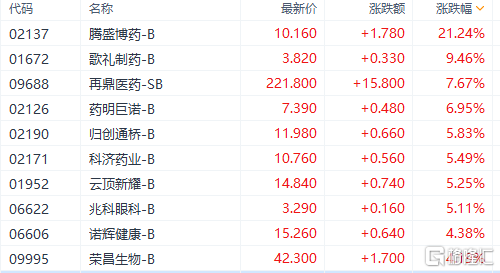
新冠特效藥概念股集體高開。其中,騰盛博藥漲超21%,歌禮制藥漲近10%,藥明巨諾、科濟藥業等跟漲。
板塊方面,旅遊、博彩、汽車、餐飲、航運港口、航空等概念漲幅居前。

發生了啥?
隔夜中概股吹響了反攻號角,強勢帶動今日港股止血回升。
昨夜美股止跌反彈,科技股迎來集體狂歡,中概更是一路飆漲。截至收盤,道指漲 1.82%,納指漲 2.92%,標普漲 2.14%;力挺疫情爆發來首次跌入熊市的納斯達克100指數(QQQ)收漲超3%,脱離熊市。
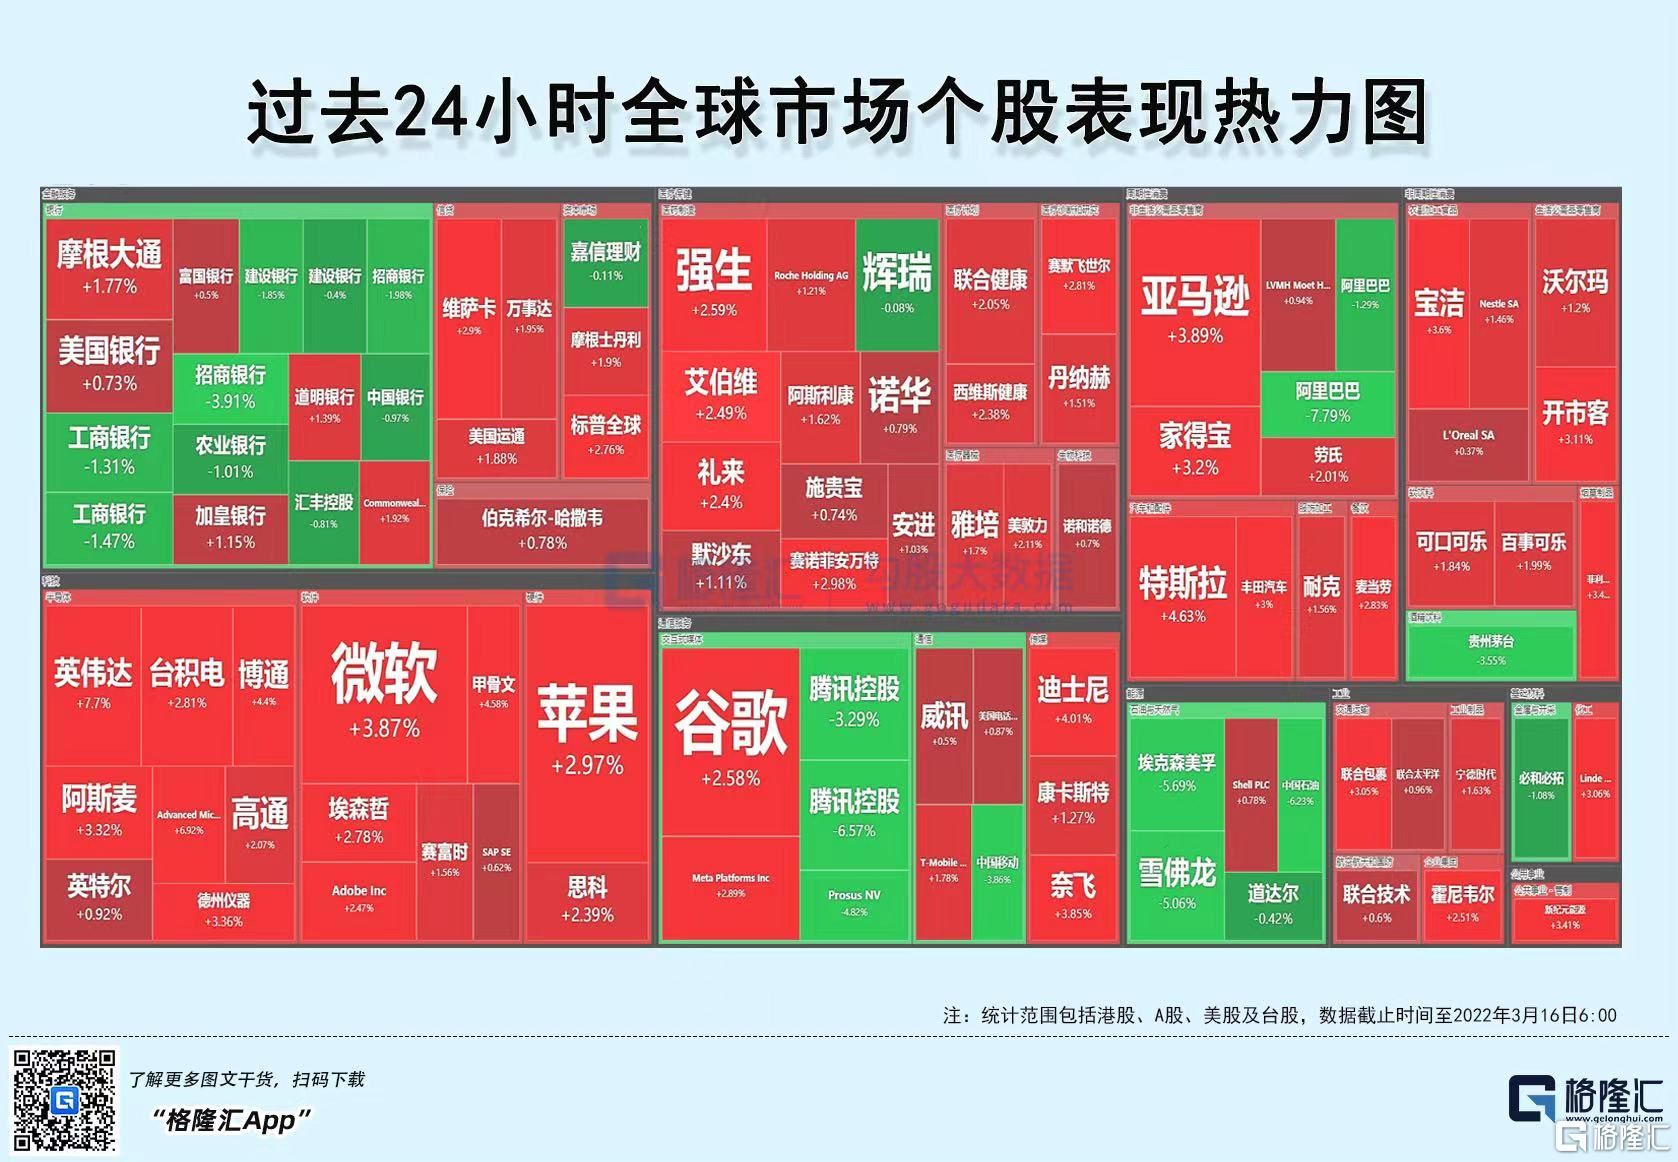
中概股表現十分強勁。霧芯科技暴漲超40%,理想大漲 12.22%,小鵬漲 7.59%,京東漲 7.08%,拼多多漲 6.97%,蔚來漲 5.89%。
大型科技股多數收漲。蘋果漲 2.97%,微軟漲 3.87%,谷歌漲 2.3%,亞馬遜收漲 3.89%,特斯拉漲 4.63%,Meta漲 2.89%。
有市場消息稱,美國公眾公司會計監督委員會PCAOB表示,正與中國監管部門保持積極溝通,近期已多次舉行會談,雙方致力於達成一份合作協議。PCAOB還表示願意與中國相關部門保持合作關係,採用目前其與數十個其他國家或地區之間類似的合作方式,開展對相關會計師事務所的檢查和調查。
經濟數據方面,美國2月PPI同比增長10%,雖刷新最高增速紀錄,但符合市場預期。PPI的環比增速及核心PPI的同環比增速均低於預期,市場減緩對通脹的擔憂,股指一路衝高,伴隨着原油和大宗商品價格大幅回落,WTI和布倫特原油連跌三日,均一度跌近9%。

持續更新中……
Follow us
Find us on Facebook, Twitter , Instagram, and YouTube or frequent updates on all things investing.Have a financial topic you would like to discuss? Head over to the uSMART Community to share your thoughts and insights about the market! Click the picture below to download and explore uSMART app!

Disclaimers
uSmart Securities Limited (“uSmart”) is based on its internal research and public third party information in preparation of this article. Although uSmart uses its best endeavours to ensure the content of this article is accurate, uSmart does not guarantee the accuracy, timeliness or completeness of the information of this article and is not responsible for any views/opinions/comments in this article. Opinions, forecasts and estimations reflect uSmart’s assessment as of the date of this article and are subject to change. uSmart has no obligation to notify you or anyone of any such changes. You must make independent analysis and judgment on any matters involved in this article. uSmart and any directors, officers, employees or agents of uSmart will not be liable for any loss or damage suffered by any person in reliance on any representation or omission in the content of this article. The content of the article is for reference only and does not constitute any offer, solicitation, recommendation, opinion or guarantee of any securities, virtual assets, financial products or instruments. Regulatory authorities may restrict the trading of virtual asset-related ETFs to only investors who meet specified requirements. Any calculations or images in the article are for illustrative purposes only.
Investment involves risks and the value and income from securities may rise or fall. Past performance is not indicative of future performance. Please carefully consider your personal risk tolerance, and consult independent professional advice if necessary.

More Content

CS Hotline: +852 3018 4526
Trading days: 24 hours | Non-trading days: 9:00-18:00


