You are browsing the Hong Kong website, Regulated by Hong Kong SFC (CE number: BJA907). Investment is risky and you must be cautious when entering the market.
“黑鐵時代”下房企的生存與挑戰

近年來,我國房地產調控政策不斷。在“三道紅線”“房住不炒”等行業調控政策下,房地產企業資金壓力增加,房企業績表現慘淡。

今年的萬科,真的進入了“黑鐵時代”。

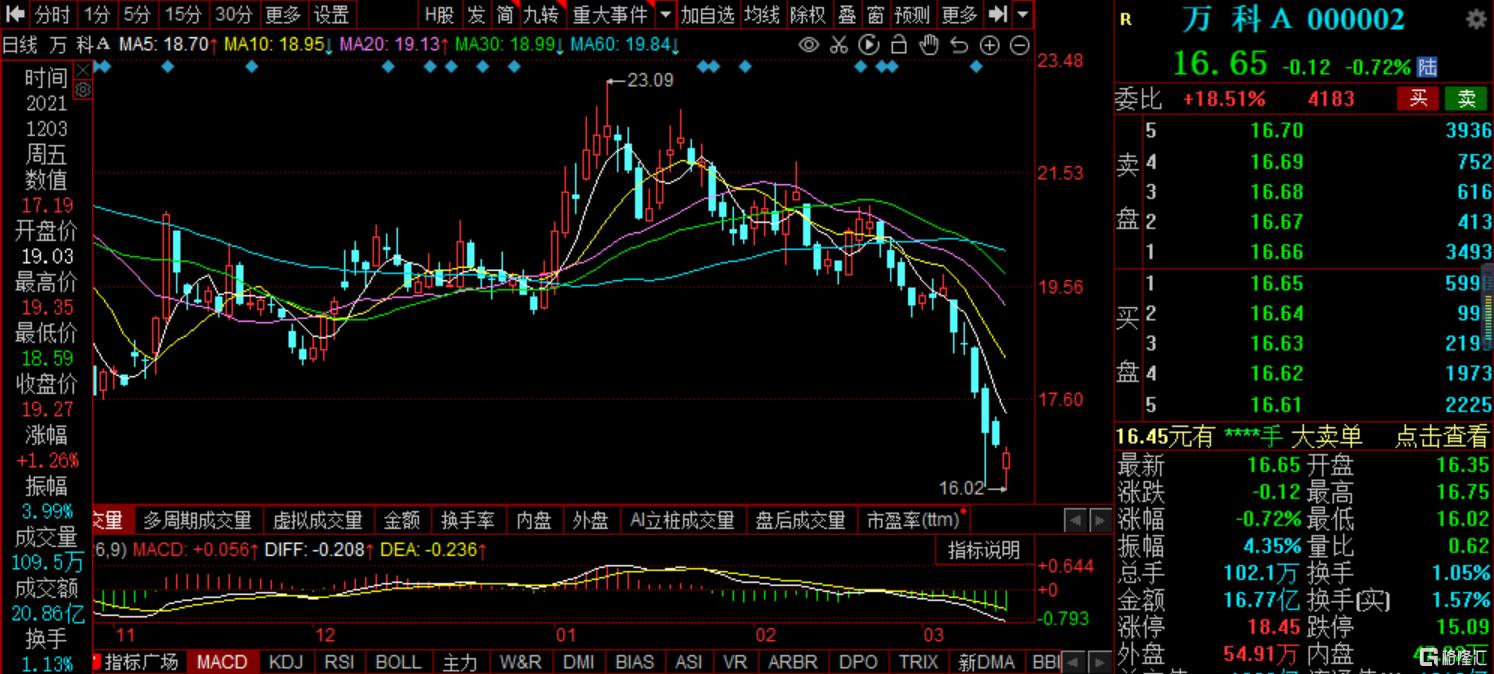
萬科A連連下跌,3月9日收盤時更是創下近五年新低16.05元/股、以16.98元/股收盤後,3月11日依舊繼續下行,收盤時報16.65元/股,近一年以來,跌幅高達47%。

今年年初,在萬科集團2022年會上,萬科董事長鬱亮做總結髮言時稱,2022年是集團破釜沉舟、背水一戰的一年,要麼死、要麼活,沒有中間狀態……

這番講話提到最多的就是“黑鐵時代”。這也是萬科給房地產行業週期做出黃金時代、白銀時代、青銅時代之後的最新判斷。

而“黑鐵時代”下的萬科,業績上也表現慘淡。萬科公吿的數據顯示,其2022年2月實現合同銷售面積185.2萬平方米,同比下降33%;合同銷售金額293.7億元,同比減少35%。2022年1-2月,萬科累計實現合同銷售面積395.8萬平方米,同比下降41%;合同銷售金額649.7億元,同比減少44.3%。

業績方面,在2021年第三季度,萬科營業收入1043.7億元,同比增長9.7%;實現歸屬於上市公司股東的淨利潤56.4億元,同比減少23.3%。

而萬科在地產業務以外的轉型,如物業服務、租賃住宅、物流倉儲、商業開發與運營等方面的佔比很小,要靠這些業務熬過凜冬活下來並不容易,也不現實。

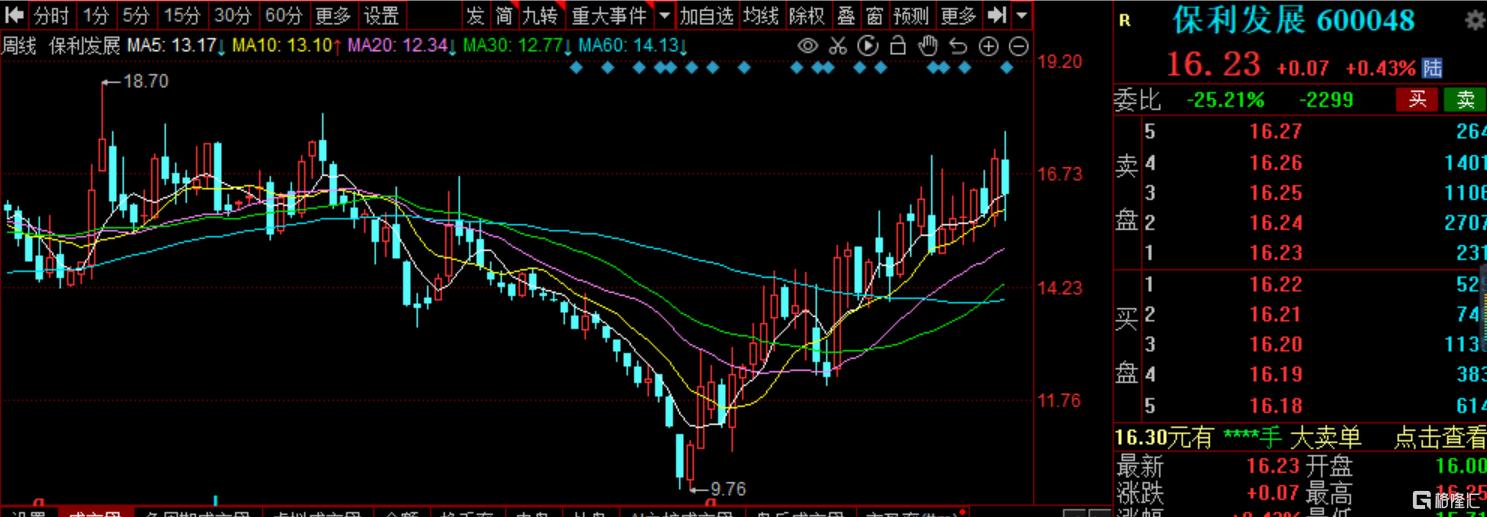
相比之下,保利發展自去年的最低點以來累計上漲81.02%。

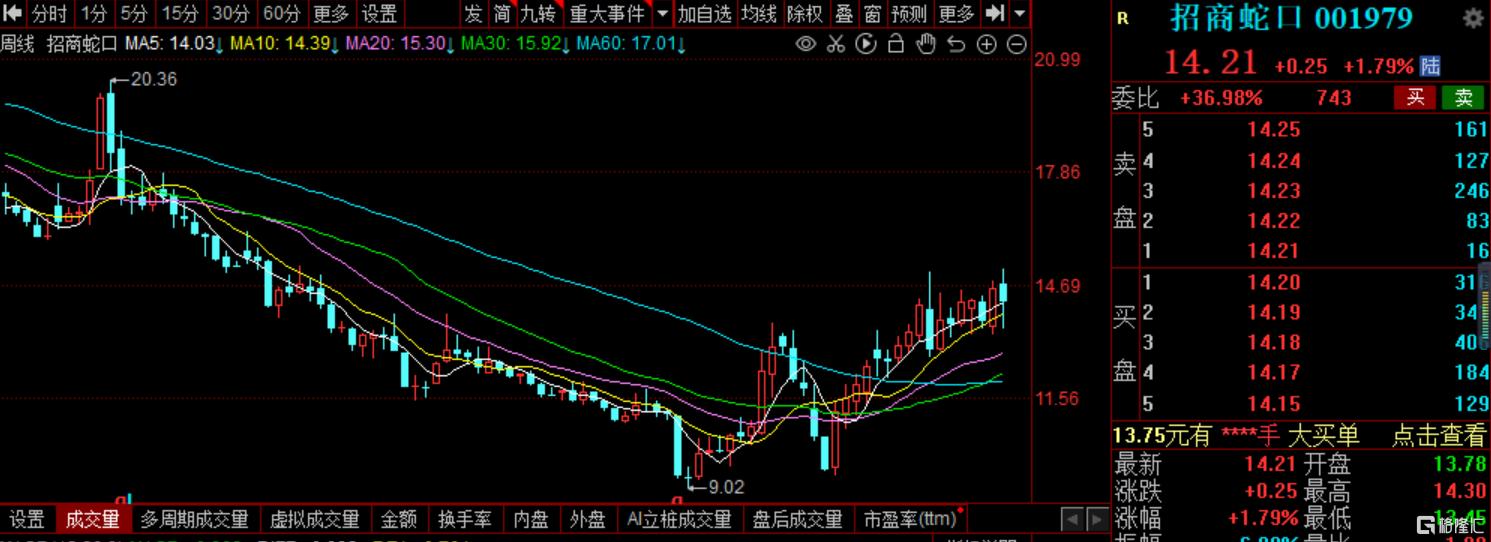
招商蛇口從去年的最低點累計上漲超過50%。

業績方面,2022年2月,保利發展實現簽約面積150.11萬平方米,實現簽約金額239.78億元;2022年1-2月,公司實現簽約面積335.87萬平方米,實現簽約金額522.80億元。

保利發展2021年度預計實現營業總收入2850.48億元,同比增加17.20%;利潤總額500.01億元,同比下降4.83%;歸屬上市公司股東的淨利潤275.77億元,同步下降4.74%。2021年全年,公司實現簽約金額5349.29億元,同比增加6.38%;實現簽約面積3333.02萬平方米,與2020年基本持平。

招商蛇口的發佈2021年度業績快報顯示,公司營業總收入16,064,341.30萬元,同比增加23.93%;利潤總額2,284,259.96萬元,同比減少5.25%。

對比其他房企,它們的表現算是不錯的。

顯然,保利發展、招商蛇口作為央企,在行業整體下行的環境下更具有穿越週期的戰略定力。

央企還具有財務穩定、經營穩健、信用優異等優勢,這些都是民營企業無法與之相比的,而這些優勢能幫助它們獲取到優質的收併購項目。

在房地產行業清整洗牌之下,也將進一步推動各類資金、土地等資源向有央企背景的頭部房企們聚攏。憑藉強大的資源護城河加上自身的多重優勢,這些企業有望進一步提升銷售規模和市場份額,迎來更大發展機會。

而萬科雖然也有國資背景,具備一定的優勢,但其背靠的地方國企深圳地鐵在融資成本等方面還無法與招商蛇口等央企相較。

從長遠來看,在“房住不炒”的主旋律下,今年房地產企業的日子依舊不會太好過。在嚴格限制房價上漲,以及供需環境走弱的市場環境中,短期商品房銷售市場放緩是必然的。剛出爐的2月份百強房企銷售數據顯示,銷售額同比下降47%。

在目前房地產行業不景氣的時期,如何活下來只是第一步,如果沒有預期和信心的恢復,就沒有銷售的回暖。

與此同時,中國人民銀行公佈的2月份金融數據顯示,中國居民中長期貸款減少459億元,為有數據統計以來的首次負增長。

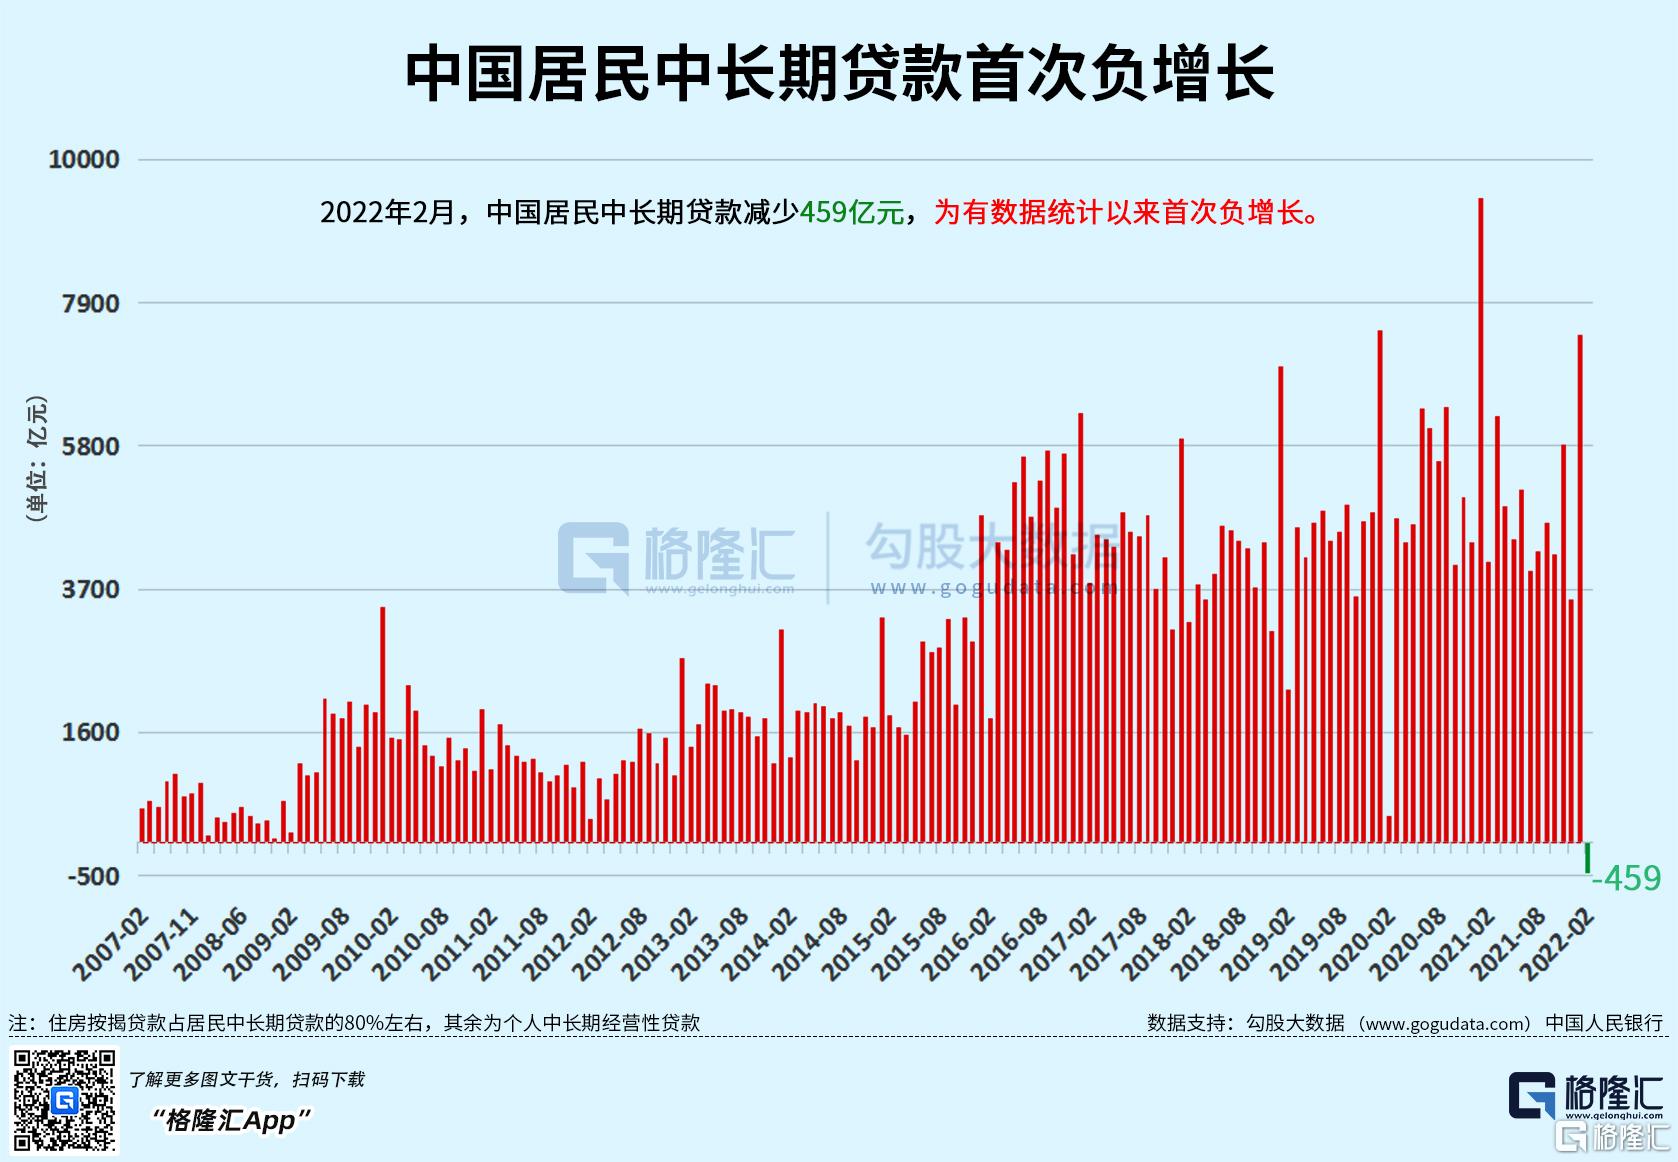
這也意味着,居民對於買房的需求與意願在下降,沒有以往那麼瘋狂與火熱了,而這個趨勢未來還將持續……

Follow us
Find us on Facebook, Twitter , Instagram, and YouTube or frequent updates on all things investing.Have a financial topic you would like to discuss? Head over to the uSMART Community to share your thoughts and insights about the market! Click the picture below to download and explore uSMART app!
Disclaimers
uSmart Securities Limited (“uSmart”) is based on its internal research and public third party information in preparation of this article. Although uSmart uses its best endeavours to ensure the content of this article is accurate, uSmart does not guarantee the accuracy, timeliness or completeness of the information of this article and is not responsible for any views/opinions/comments in this article. Opinions, forecasts and estimations reflect uSmart’s assessment as of the date of this article and are subject to change. uSmart has no obligation to notify you or anyone of any such changes. You must make independent analysis and judgment on any matters involved in this article. uSmart and any directors, officers, employees or agents of uSmart will not be liable for any loss or damage suffered by any person in reliance on any representation or omission in the content of this article. The content of the article is for reference only and does not constitute any offer, solicitation, recommendation, opinion or guarantee of any securities, virtual assets, financial products or instruments. Regulatory authorities may restrict the trading of virtual asset-related ETFs to only investors who meet specified requirements. Any calculations or images in the article are for illustrative purposes only.
Investment involves risks and the value and income from securities may rise or fall. Past performance is not indicative of future performance. Please carefully consider your personal risk tolerance, and consult independent professional advice if necessary.
uSMART
Wealth Growth Made Easy
Open Account