市場再怎麼震盪,恐慌指數也無動於衷?
本文來自:金十數據,作者:李溥嵌
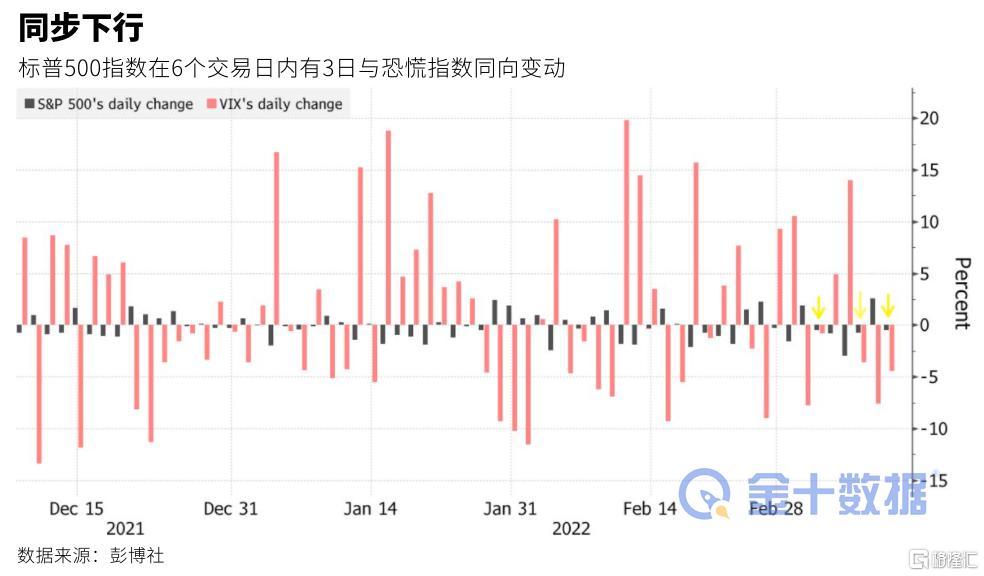
芝加哥期權交易所波動率指數(VIX恐慌指數)通常被視為市場情緒的直觀指標,其通常在市場大跌時跳漲。但奇怪的是,標普500指數於週四下跌了1.6%,而VIX恐慌指數在日內大部分時間內要麼在震盪,要麼也在下跌,這種情況非常少見。
VIX恐慌指數旨在追蹤與標普500指數相關的期權成本,其歷來於與股指呈反向走勢。但最近,其在6個交易日內有3個交易日與股指同向變動。此類走勢可能表明,市場缺乏採取套期保值手段去防範損失的意願。
VIX恐慌指數已連續九日保持在30以上,這是自2020年6月以來的最高水平。俄烏衝突後的央行貨幣政策走向、市場的新不確定性以及難以預測的經濟增長走向,導致2022年的市場幾乎每天都會出現令人震驚的逆轉。
交易者們已經習慣了市場的大幅震盪,但機構持倉頭寸的重大轉變則可能為更穩固的市場奠定了基礎。
摩根大通大宗經紀業務的客户數據顯示,多空對沖基金已連續七天大幅削減風險頭寸,並引發了一年多來最快的市場“去風險化”。RBC Capital Markets股票衍生品策略師Amy WuSilverman表示:
“人們又回到尋找最優對沖與交易點位的時候了。你還可以看到人們在出售這種波動性並進行overwriting(在假設期權不會行權的情況下出售溢價期權的策略)。這可能會損害市場的流動性。”
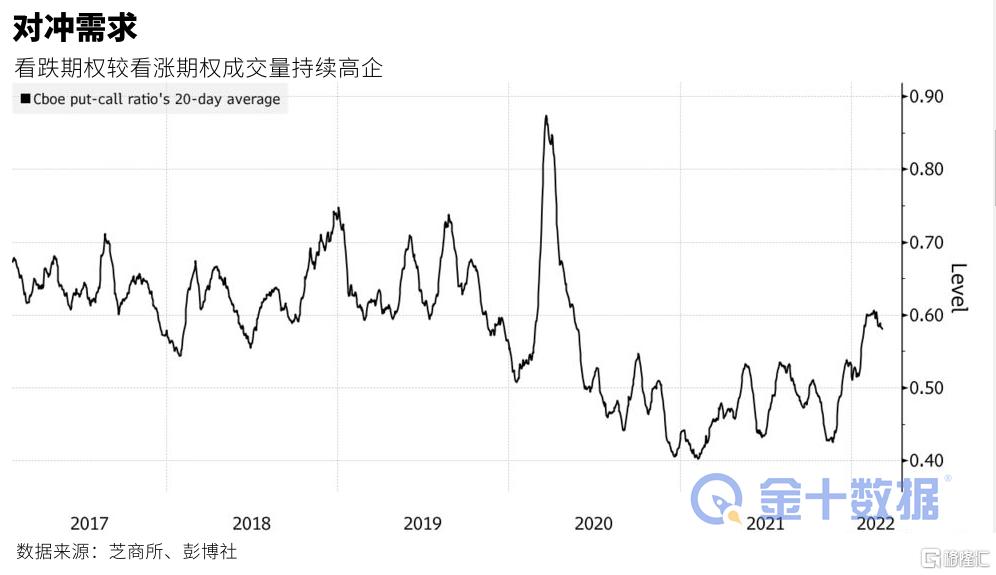
從看跌期權與看漲期權的成交量中也可以看到,市場的防禦態勢很明顯。芝加哥期權交易所股票看跌/看漲比率(put callratio)的20日均線徘徊在22月高位附近,這是市場謹慎的跡象。
摩根大通數據顯示,同時進行看漲和看跌股票押注的專業投機者的名義股票敞口從年內高點下跌了25%有餘。儘管它們的槓桿水平尚未達到類似2020年3月疫情爆發期間或2018年12月的拋售期間的低谷,但連續7天的風險平倉的持續時間已接近壓力時期通常會持續的天數(8到12天)。
摩根大通分析師John Schlegel認為,持續的去風險表明,如果地緣政治消息開始好轉,市場可能已經經歷了去槓桿化的過程中最糟糕的階段。John Schlegel表示:
“雖然市場風險很大程度上取決於下週美聯儲所公佈的利率決議,但近期的去槓桿行為,特別是在全權委託股票L/S基金(discretionary equity L/S funds)中的去槓桿行為,表明市場風險可能已接近尾聲了。”
Susquehanna Financial Group策略師Christopher Jacobson指出,過去一週有投資者通過幾個較大的比率看漲期權價差在VIX恐慌指數中進行尾部對沖。週一,有位投資者賣出在6月份到期的1萬份行權價為40點的看漲合約並買入6萬份看漲期權,以押注VIX恐慌指數將達到90。
Jacobson認為,這種對沖保護的交易策略,使波動性市場對標的股票的反應減弱。他表示:
“當隱含波動率較高時,同樣的1%的下跌相對‘在預期之內’,因此波動性通常不會有同樣的上行壓力,它實際上大概率會下降。按同樣的思路,當時的投資者有更多的機會和時間進行對沖交易,因此這些相同的市場波動可能不會引發那麼多的對沖交易行為。”
Follow us
Find us on
Facebook,
Twitter ,
Instagram, and
YouTube or frequent updates on all things investing.Have a financial topic you would like to discuss? Head over to the
uSMART Community to share your thoughts and insights about the market! Click the picture below to download and explore uSMART app!

Disclaimers
uSmart Securities Limited (“uSmart”) is based on its internal research and public third party information in preparation of this article. Although uSmart uses its best endeavours to ensure the content of this article is accurate, uSmart does not guarantee the accuracy, timeliness or completeness of the information of this article and is not responsible for any views/opinions/comments in this article. Opinions, forecasts and estimations reflect uSmart’s assessment as of the date of this article and are subject to change. uSmart has no obligation to notify you or anyone of any such changes. You must make independent analysis and judgment on any matters involved in this article. uSmart and any directors, officers, employees or agents of uSmart will not be liable for any loss or damage suffered by any person in reliance on any representation or omission in the content of this article. The content of the article is for reference only and does not constitute any offer, solicitation, recommendation, opinion or guarantee of any securities, virtual assets, financial products or instruments. Regulatory authorities may restrict the trading of virtual asset-related ETFs to only investors who meet specified requirements. Any calculations or images in the article are for illustrative purposes only.
Investment involves risks and the value and income from securities may rise or fall. Past performance is not indicative of future performance. Please carefully consider your personal risk tolerance, and consult independent professional advice if necessary.


