跳水與反彈:期盼和平
本文來自格隆匯專欄:洪灝,作者:洪灝
要點:
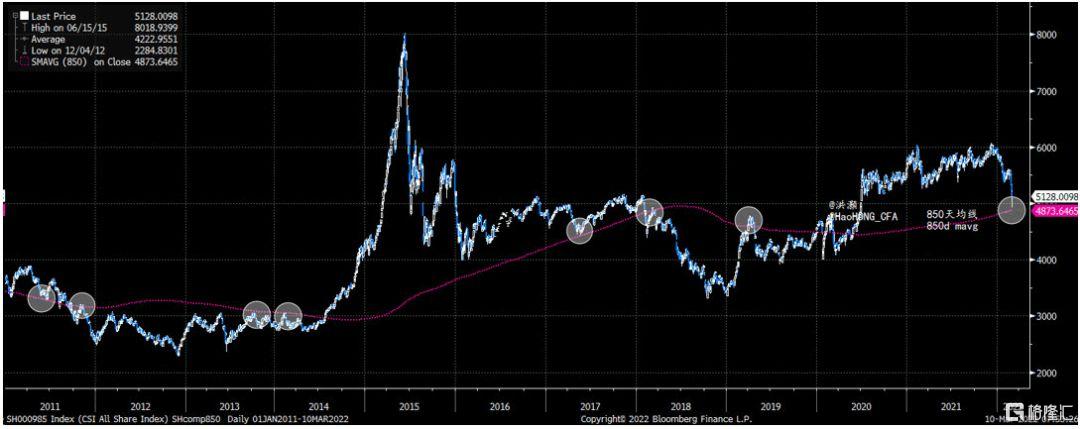
- 上證在850日移動均線處上演了一場戲劇性的盤中反轉,這是一條與中國經濟短週期同步運行的重要長期市場趨勢線。盤中低點距離850天線僅10個點。
- 昨日交易中,上證的最低點為3,157點,而去年12月的峯值為3,709點。該區間與我們去年11月在2022年展望報吿中列出的略低於3,200至略低於3,800之間的預測交易區間一致。
- 中國市場正在經歷“增長恐慌”。來自烏克蘭的積極事態發展有所幫助。就目前而言,我們應該從這些技術上重要的水平上技術性反彈。
昨日,上證上演了一場戲劇性的盤中逆轉。逆轉的發生,就像午盤後的暴跌一樣突如其來。午餐後,上證從盤中高點附近暴跌了近5%,然後才開始修復,中證全A指數盤中最大跌幅超過了5%。交易員們傻眼了,爭先恐後地先止損,然後試圖緩過來尋找拋售潮的原因。
現在的市場如果出現無法解釋的盤中走勢,許多人會認為是國家隊的干預。而昨天引用這樣的典故就方便了。據報道,央行向財政部上繳了一萬億元人民幣的留存收益,作為2022年財政預算的一部分。在我們週一題為《薛定諤的核炸彈》的報吿中,我們強調,今年的財政赤字實際上將高於紙面上的2.8%,因為國有實體將會把其部分留存收益繳入預算,很可能佔財赤的1%以上,以確保今年5.5%的GDP增長目標。
昨天的交易盤中還驚現一些交易異象。上證跌至850日移動均線後,忽然逆轉了方向(圖表 1)。自2016年以來,我們率先對中國經濟週期進行定量研究,並將我們的經濟週期理論應用於宏觀策略。850天移動平均線的計算週期與3.5年的經濟短週期的波長相同。這是根據中國經濟短週期的時間跨度而進行的宏觀市場邏輯,並非技術分析。
圖表1:上證在850日線上盤中大幅逆轉
資料來源:彭博,交銀國際
我們必須強調的是,這一長期移動平均線只表明了交易員應該關注的指數的重要水平。這條均線顯示了市場指數的長期趨勢,以及它如何與經濟週期同步運行。它一直與上證歷史上的許多拐點或重要的點位相吻合。其他主要的市場指數也如此。
自從2016年我們發表了關於中國經濟週期及其在市場分析中的應用的論文以來,850天線已迅速成為中國市場最受關注的技術指標之一。關注度越高,其重要性也就越大。
但為什麼昨天突然跳水呢?
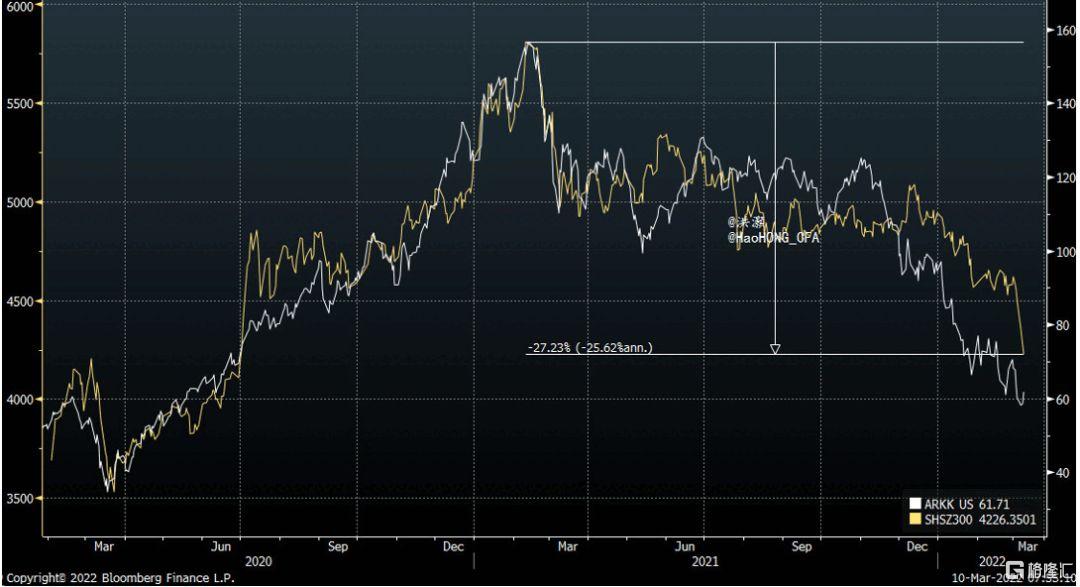
我們認為,中國市場正在經歷一場“增長恐慌”。滬深300的走勢與方舟創新ETF密切相關,後者是以“木頭姐”為首的知名增長基金(圖表 2)。兩個世界相距甚遠的指數之間如此密切的關聯表明,這兩個指數都受到類似的宏觀經濟因素的影響。
雖然3月5日的會議為2022年制定了一個雄心勃勃的增長目標,但也面臨許多挑戰。最重要的是,把預算裏的各種詳細討論的隱含信息交叉驗證,我們可以看到,2022年中國的宏觀槓桿將保持穩定。在週一的報吿《薛定諤的核炸彈》中,我們展示了中國股市的表現如何與宏觀槓桿密切相關。昨日午間交易前,監管機構又進行了一些討論,進一步闡明瞭在2022年保持宏觀槓桿大致穩定的觀點。這很可能是昨天股市暴跌的原因之一。但隨後,烏克蘭戰爭戰線上的一些積極事態發展,為談判鋪平了道路,這肯定有助於情緒的逆轉,而不是國家隊。
圖表2:CSI 300 vs ARKK:顯示“增長恐慌”
資料來源:彭博,交銀國際
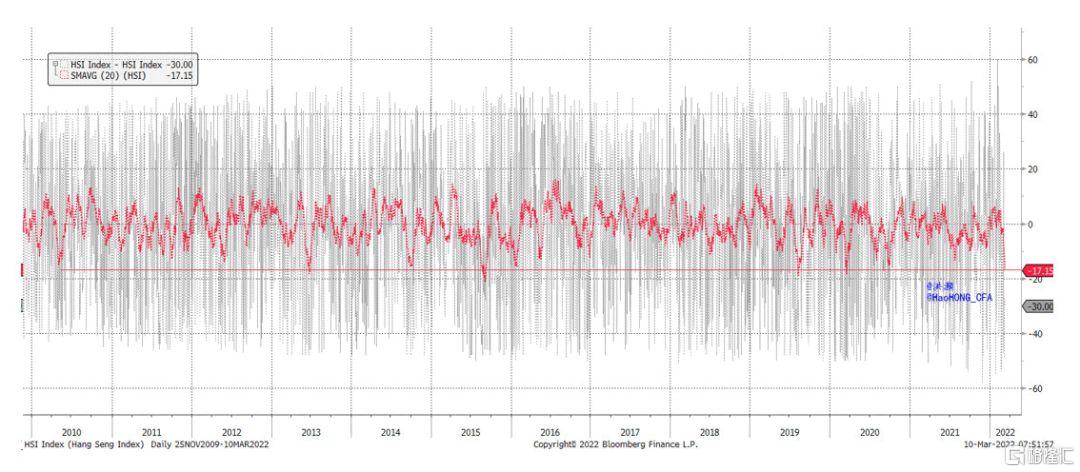
總而言之,境內外市場都處於超賣狀態。恆生指數的超跌強度堪比2020 年 3 月“大流行”時期的拋售潮,並與過去十年恆生指數經歷的許多其他歷史性事件等量齊觀(圖表 3 )。在我們去年11月發佈的2022年展望中,我們預測未來 12個月上證的交易區間在略低於 3,200 至略低於 3,800 之間,而最壞的情況是略低於 3,000 。現在,指數應該至少從這些重要的技術水平上技術性反彈。隨着烏克蘭問題前景逐漸明朗,市場的焦點將回到中美經濟的週期與衝突上。
圖表3:從技術層面看,恆生指數近期也處於超賣狀態
資料來源:彭博,交銀國際
Follow us
Find us on
Facebook,
Twitter ,
Instagram, and
YouTube or frequent updates on all things investing.Have a financial topic you would like to discuss? Head over to the
uSMART Community to share your thoughts and insights about the market! Click the picture below to download and explore uSMART app!

Disclaimers
uSmart Securities Limited (“uSmart”) is based on its internal research and public third party information in preparation of this article. Although uSmart uses its best endeavours to ensure the content of this article is accurate, uSmart does not guarantee the accuracy, timeliness or completeness of the information of this article and is not responsible for any views/opinions/comments in this article. Opinions, forecasts and estimations reflect uSmart’s assessment as of the date of this article and are subject to change. uSmart has no obligation to notify you or anyone of any such changes. You must make independent analysis and judgment on any matters involved in this article. uSmart and any directors, officers, employees or agents of uSmart will not be liable for any loss or damage suffered by any person in reliance on any representation or omission in the content of this article. The content of the article is for reference only and does not constitute any offer, solicitation, recommendation, opinion or guarantee of any securities, virtual assets, financial products or instruments. Regulatory authorities may restrict the trading of virtual asset-related ETFs to only investors who meet specified requirements. Any calculations or images in the article are for illustrative purposes only.
Investment involves risks and the value and income from securities may rise or fall. Past performance is not indicative of future performance. Please carefully consider your personal risk tolerance, and consult independent professional advice if necessary.


