


Author & nbsp; | Amano
Data support & nbsp; | & nbsp; big data (www.gogudata.com)

Hello, everyone. I'm Amano. There is no need for me to say what happened today, and the market is completely affected by this mood.
In the past, we could not judge whether a fight could be fought, but the result could only indicate whether or not an incident of this level should be played. It is not something that we can judge by reading some foreign media news and learning a little knowledge of history and geopolitics, but it is still 2 young 2 simple.
Today, the overall state is basically as follows, and because of the epidemic, we have been queuing up for nucleic acid, and it turns out that this battle is faster than queuing up for nucleic acid.
On the market, the A-share gem index once fell more than 3% today, nearing the close. By the close, the Shanghai Composite Index was down 1.7%, the Shenzhen Composite Index was down 2.2%, and the gem Index was down 2.8%. There was a net outflow of 3.3 billion northbound funds. Individual stocks in the two cities generally fell, falling by more than 3900, and the transaction between the two cities was enlarged to 1.3 trillion, with an obvious money-loss effect, as many netizens ridiculed. It feels like we paid for the war over there.
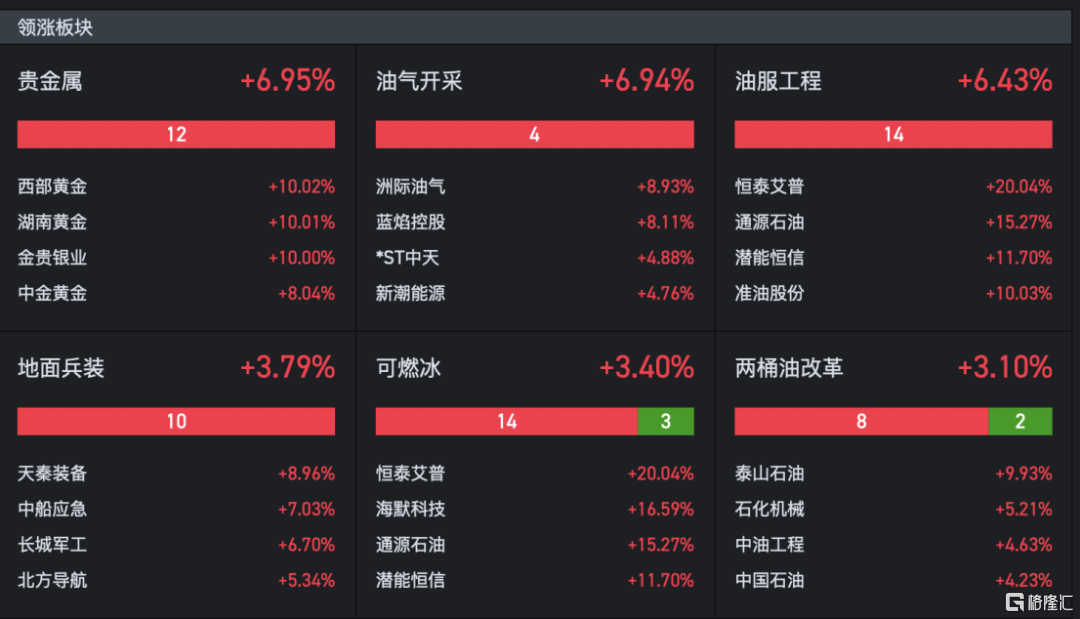
On the whole, the concept of theme has basically plummeted, with the largest decline in the concept of digital currency, with the plate falling by 7.1%. East and West, Yuan Universe and so on have also become the main force to kill. Because of the news from Soviet Russia, most resource stocks, such as oil and gas exploration, precious metals, national defense and military industry, continued to be strong in the afternoon, Tianhe defense rose by the limit, Morninglight Airlines and Xinyu National Science closed at more than 10% one after another. Oil and gas production plate rose sharply, quasi-oil shares, Zhongman Petroleum and other stocks rose by the limit, COSL, petrochemical oil service and so on rose.
In terms of track stocks, the photovoltaic branch HJT performed well and did not suffer too many fluctuations, mainly due to the outstanding performance of the installed data in January. By the end of the day, Ottaway, Jiajia Weichuang and Trina Solar, had closed up more than 3%. In terms of chips, the performance of military chips is OK, special gases also withstand the decline, and Walter gases and distant gases are rising against the trend, mainly because of the Russian-Ukrainian concept.
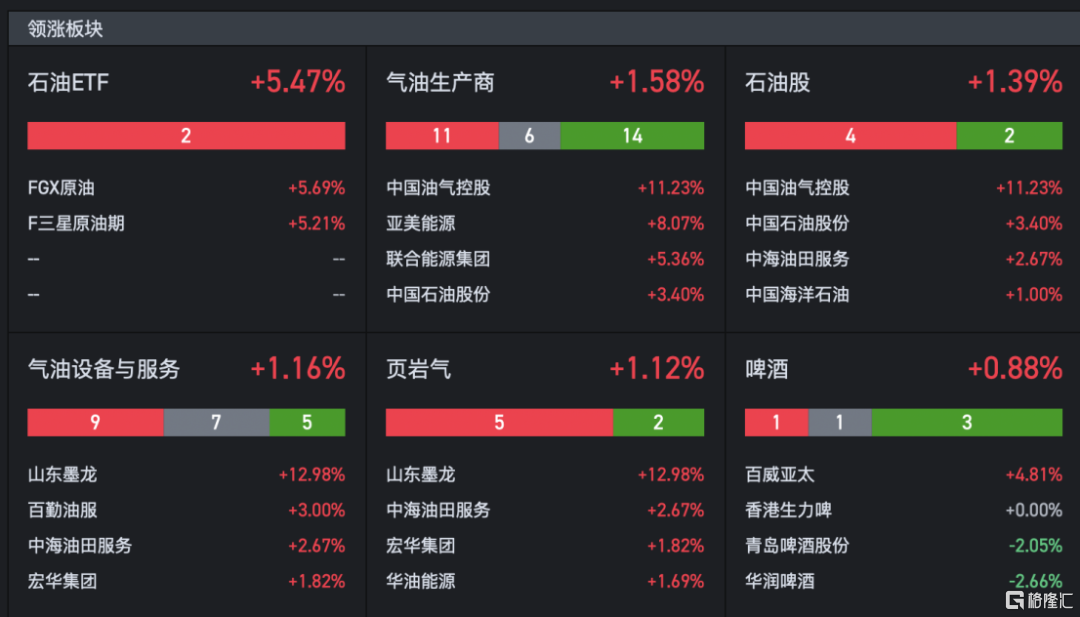
On the side of Hong Kong stocks, the performance of the oil sector is also relatively outstanding, and the performance of science and technology is still very poor.
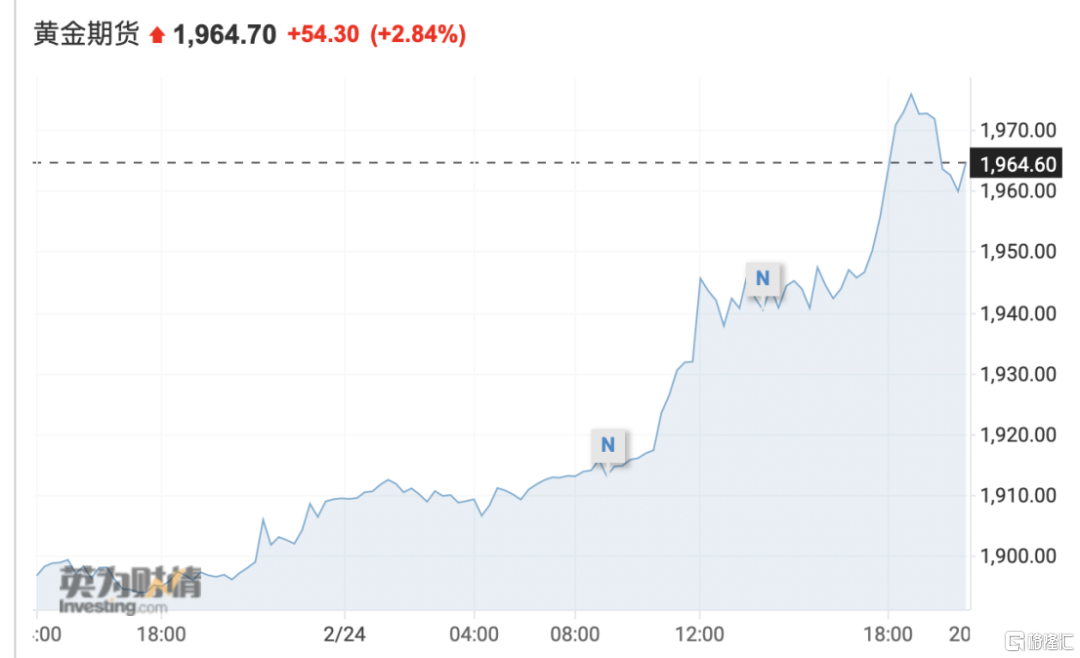
Commodity futures have performed well, especially gold, which is a safe haven.
For the stock market, just found such a picture, is the performance of the S & P 500 for some of the previous conflicts, the basic conclusion is that the impact is very negative in a short period of time. But the long-term will not affect the direction of the stock market itself.
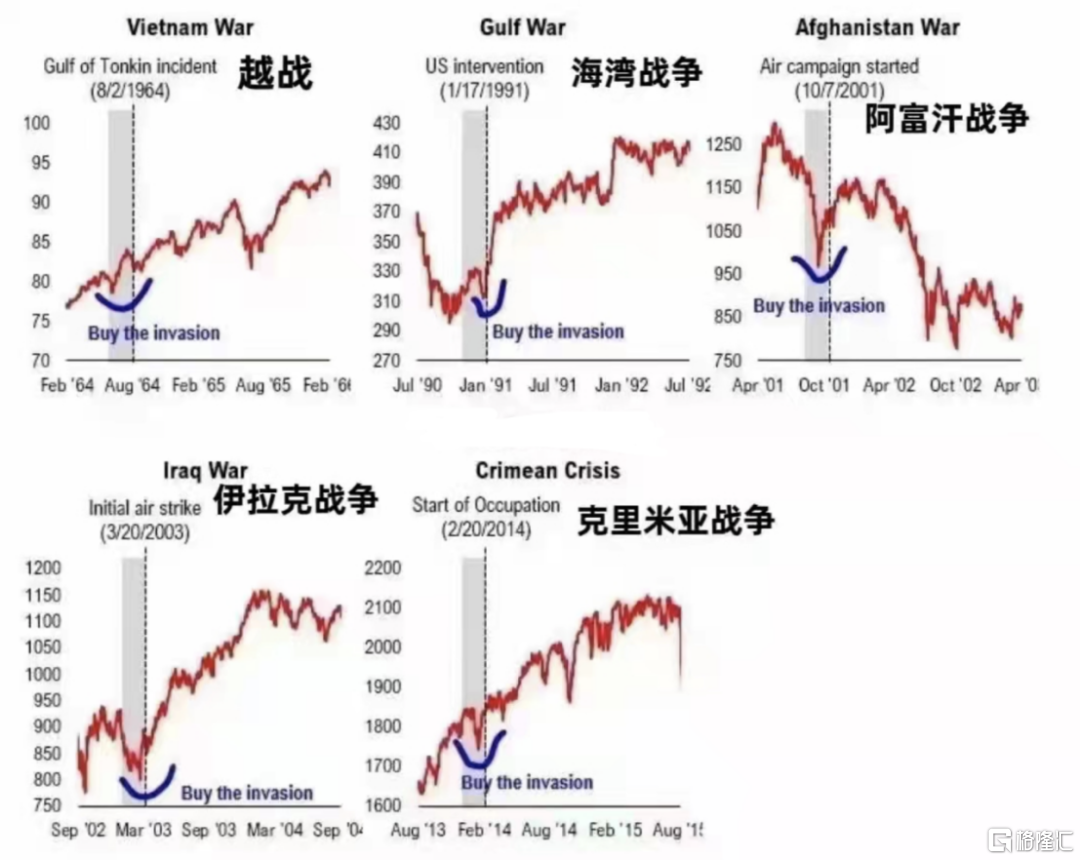
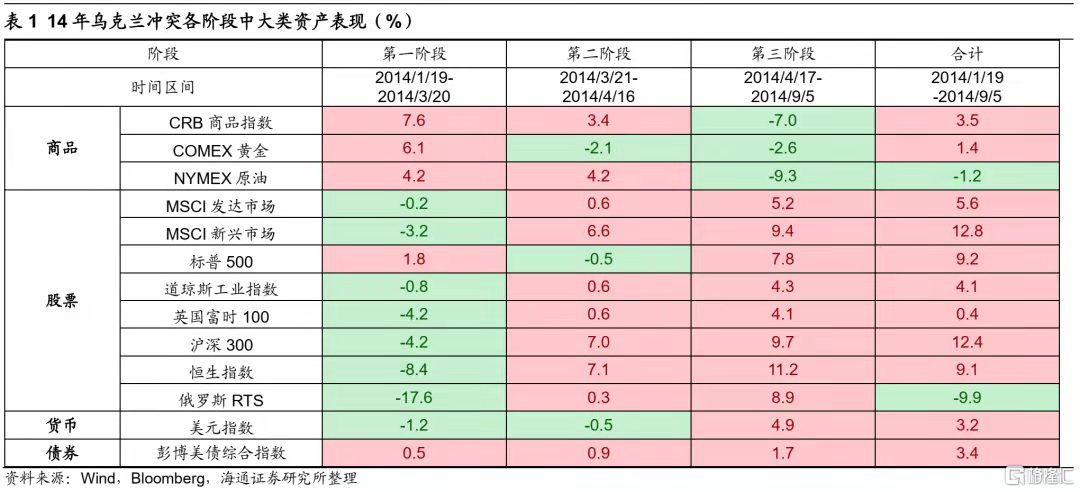
With reference to the stage performance of the 14-year conflict between Russia and Ukraine, the same result can be obtained. If the conflict is divided into three stages, the first stage is basically the good performance of commodities, and the latter is that stocks perform better.
In the first stage, tensions in Kiev, the capital of Ukraine, intensified before Putin formally signed the treaty on Crimea's entry into Russia, that is, from 2014-1-19 to 2014-3-20.
The second stage, from the signing of the Treaty of Crimea into Russia to the quadripartite talks held by the United States, Russia, Ukraine and the European Union in Geneva and the issuance of a joint statement, that is, from 2014-3-21 to 2014-4-16.
In the three stages, the Quartet talks reached the Minsk ceasefire agreement, that is, 2014-4-17-2014-9-5.
Looking back at the performance of large categories of assets in these three stages, we can see that commodities performed better and equity assets performed poorly in the first stage (2014-1-19-2014-3-20): COMEX gold (hereinafter referred to as gold, the same below) rose 6.1 per cent, NYMEX crude oil (hereinafter referred to as crude oil, the same below) rose 4.2 per cent, the Dow Jones Industrial average fell 0.8 per cent, CSI 300 fell 4.2 per cent, and Russia's RTS index fell even more, by 17.6 per cent.
In the second stage (2014-3-21-2014-4-16), the performance of stock assets picked up somewhat, with the CSI 300 up 7.0 per cent, the Dow Jones Industrial average up 0.6 per cent and Russia's RTS index up 0.3 per cent, while commodities were mixed. Crude oil prices continued to rise by 4.2 per cent, while gold fell by 2.1 per cent.
The performance of commodities and stocks in the third stage (2014-4-17-2014-9-5) was contrary to that of the first stage. Stocks performed better, with the CSI 300 up 9.7%, the Dow Jones Industrial average up 4.3%, and Russia's RTS index up 8.9%. Commodities performed poorly, with the CRB Commodity Index (down 7.0%, the same below) and crude oil (down 9.3%) falling sharply in the first and second stages, while gold fell 2.6%. In addition, the Bloomberg Treasury Composite Index made positive gains in all three stages of the 2014 conflict in Ukraine.
Therefore, in the short term, we should maintain the direction we were optimistic about before. Recently, we can take a closer look at the growth stocks, because according to the progress of Russia and Ukraine, the fighting will really end in a few hours, and the speed of fighting may be faster than we expected. Of course, let's take a look at the performance of US stocks tonight.


More Content


