美因基因二度遞表港交所:毛利率提升至72%,依賴關聯方客户
據格隆匯新股瞭解,美因基因於2月17日再次向港交所提交了招股説明書,擬港股主板IPO上市,中信建投國際為其獨家保薦人。這是繼2021年8月16日首次遞表“失效”後的,第二次衝擊上市。
1
依賴關聯方客户
美因基因成立於2016年1月,主要附屬公司美因北京,開始提供基因檢測服務。
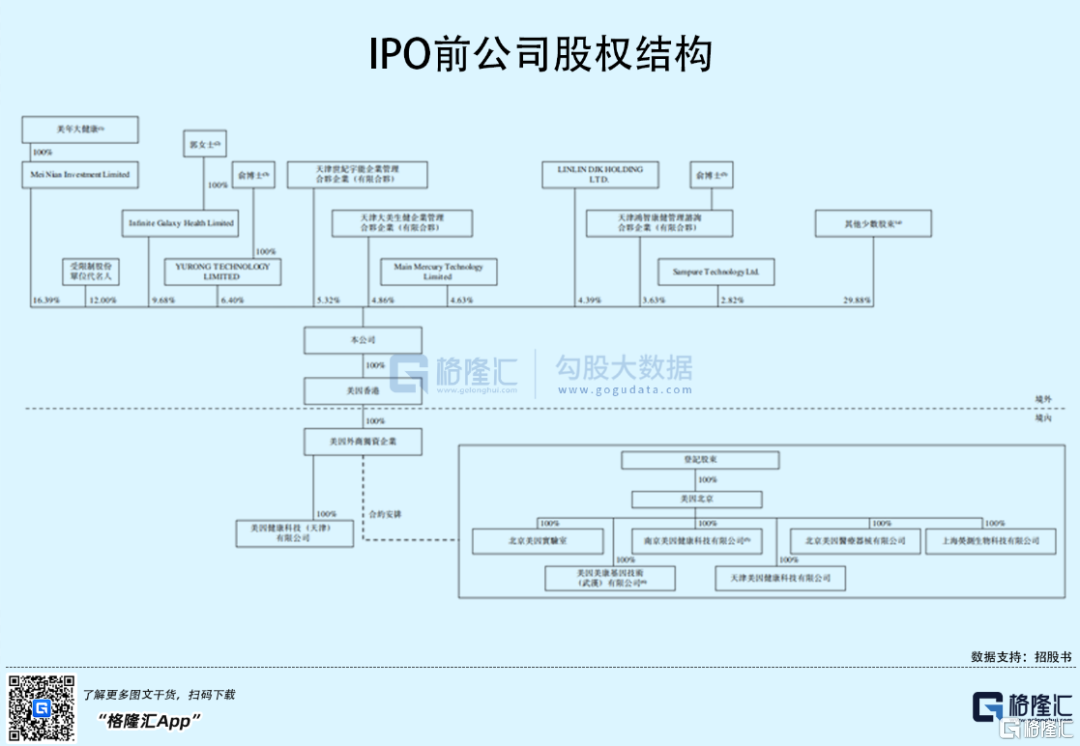
2016年6月,美年大健康以200萬元的交易對價獲得上海天億持有的美因北京20%的股權。同年10月,經過A輪融資過後,美年大健康持有公司17.14%股權,上海天億為其第一大股東,持股比例33.42%。
2018年7月,上海天億完成了其於美因北京的全部股權轉讓給美年大健康,此後上海天億不再為美因北京的股東,A輪融資後股權轉讓事項完成後,美年大健康也由此成為公司第一大股東,持股比例達到50.56%。
2020年之後,經過B輪融資及股權轉讓,美年大健康開始陸續減持公司股份,持有股份佔比下滑至18.63%。截至IPO前,美年大健康通過Mei Nian Investment Limited持有公司16.39%股份。
作為美年大健康的實際控制人俞博士,與郭女士、美年大健康共同控制公司約36.10%的表決權,為單一最大股東組別。
值得注意的是,近年來,美因基因收入的很大一部分來源於關聯方,即通過美年大健康和俞博士,2018年-2021年前三季度,與關聯方交易所得收入分別佔公司同期收入的47.4%、51.1%、57.9%及54.3%。依賴關聯方客户一定程度上反映出公司對外開展業務的能力不足,同時若合作關係產生衝突,或將對公司業績造成衝擊。
2
研發費用率較低
美因基因是一家專注於消費級基因檢測及癌症篩查服務的基因檢測平台公司。截至2021年9月底,公司進行了超過11百萬次基因檢測,2020年平均每月進行逾230,000次檢測。
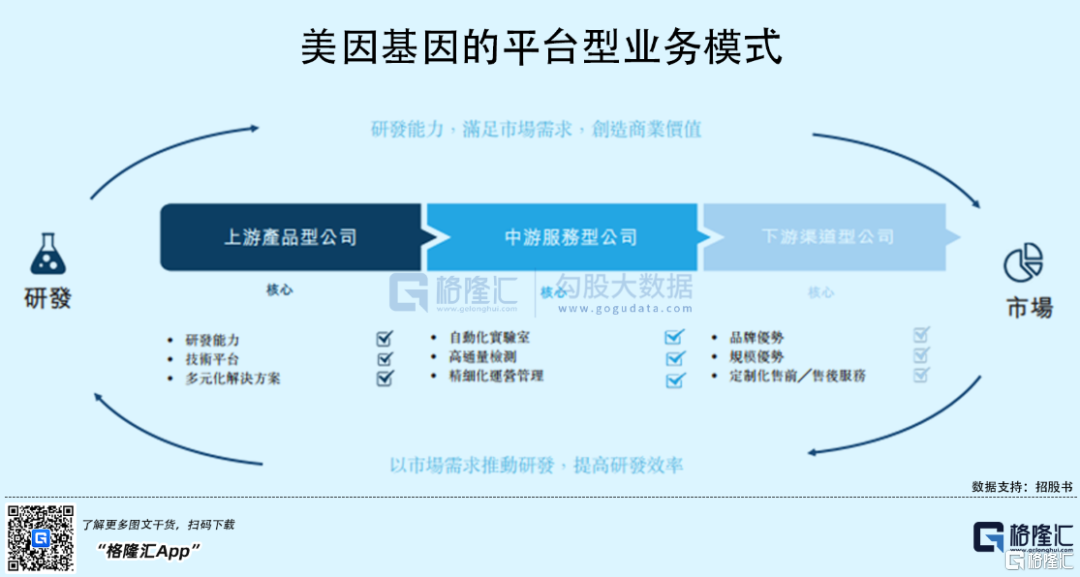
弗若斯特沙利文數據顯示,按累計已進行檢測量計,美因基因為中國最大型消費級基因檢測平台,並且是全球三大消費級基因檢測平台之一。若按2020年已進行檢測量計,公司是中國規模最大的癌症篩查基因檢測平台。
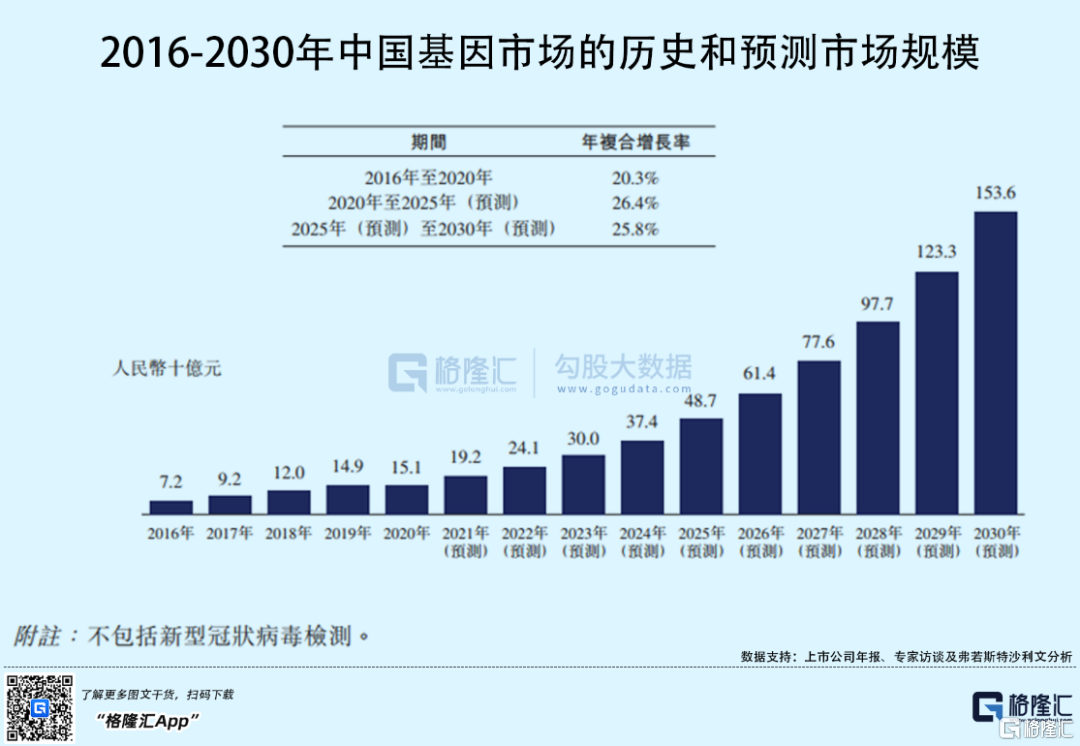
近年來,基因檢測一直被廣泛應用於醫療健康各場景裏,中國基因檢測市場規模由2016年的72億元增長到2020年的151億元,年複合增長率為20.3%,預計到2030年將增長至1536億元。其中,消費級基因檢測市場預計2030年達到26億美元。
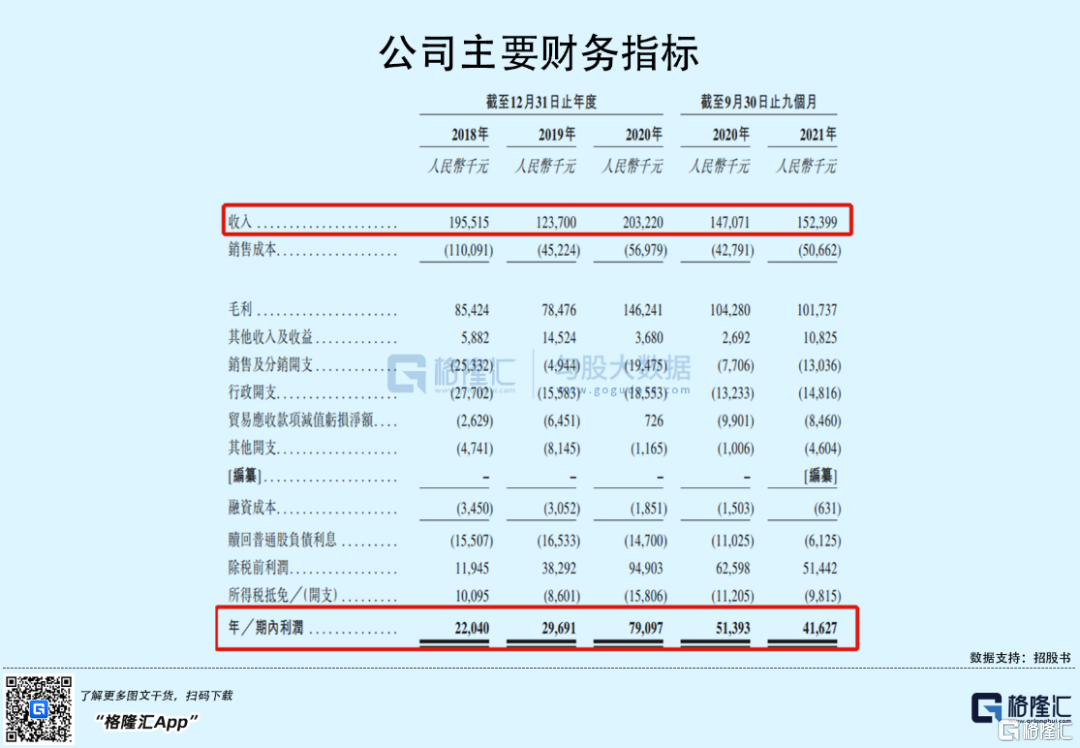
得益於此,2018年-2020年,公司實現收入分別為1.96億元、1.24億元、2.03億元;相對應的淨利潤分別為2204萬元、2969.1萬元、7909.7萬元。同期,公司毛利率持續增長,由43.7%上升至72%。
按於2020年產生的收入計,美因基因的市場份額為34.2%,在中國消費級基因檢測市場排名第一,高於五名最接近競爭對手的合併市場份額。同時,公司亦是中國唯一在消費級基因檢測行業實現盈利的公司。
分業務來看,消費級基因檢測服務是公司的主要收入來源,收入佔比超7成;癌症篩查服務為其第二大業務,近年來收入增長快速,佔比由2018年的2.6%增長至2020年的20.4%,2021年前三季度一躍上升至44.9%,主要得益於結直腸癌篩查檢測服務銷量暴增,銷售量由2018年的1.4萬次檢測上升至2020年的10.6萬次檢測,2021年前三季度達17萬次檢測。由此,2020年,美因基因為中國結直腸癌基因檢測服務的最大提供商。
截至目前,美因基因正在開發8種檢測試劑盒,其中3中為消費級基因檢測產品,其餘5中為疾病篩查產品,當前尚未有產品在國家藥監局註冊。

值得一提的是,報吿期內美因基因的研發投入並不高,其研發成本分別為675.4萬元、439萬元、444.6萬元,研發費用率分別為3.45%、3.55%、2.19%,遠低於同行業華大基因、達安基因等的研發費用率。
與此同時,美因基因2021年前三季度增收不增利,營收為1.52億元,同比增長3.6%;而期內利潤為4163萬元,較上年同期的5139萬元下降19%,一定程度上受到與新型冠狀病毒有關的檢驗服務平均單價下降的影響。
3
小結
依靠美年大健康,美因基因在檢測數量及業績方面取得一定成績,但也因此反映出公司對外拓展業務的能力略顯薄弱,加上其研發費用率較低、尚未有IVD候選產品註冊,公司能否保持中國基因檢測領域這一領先地位,還有待時間驗證。
Follow us
Find us on
Facebook,
Twitter ,
Instagram, and
YouTube or frequent updates on all things investing.Have a financial topic you would like to discuss? Head over to the
uSMART Community to share your thoughts and insights about the market! Click the picture below to download and explore uSMART app!

Disclaimers
uSmart Securities Limited (“uSmart”) is based on its internal research and public third party information in preparation of this article. Although uSmart uses its best endeavours to ensure the content of this article is accurate, uSmart does not guarantee the accuracy, timeliness or completeness of the information of this article and is not responsible for any views/opinions/comments in this article. Opinions, forecasts and estimations reflect uSmart’s assessment as of the date of this article and are subject to change. uSmart has no obligation to notify you or anyone of any such changes. You must make independent analysis and judgment on any matters involved in this article. uSmart and any directors, officers, employees or agents of uSmart will not be liable for any loss or damage suffered by any person in reliance on any representation or omission in the content of this article. The content of the article is for reference only and does not constitute any offer, solicitation, recommendation, opinion or guarantee of any securities, virtual assets, financial products or instruments. Regulatory authorities may restrict the trading of virtual asset-related ETFs to only investors who meet specified requirements. Any calculations or images in the article are for illustrative purposes only.
Investment involves risks and the value and income from securities may rise or fall. Past performance is not indicative of future performance. Please carefully consider your personal risk tolerance, and consult independent professional advice if necessary.


