力勤資源赴港IPO:年入77.6億,鎳礦資源採購依賴海外國家
據格隆匯新股瞭解,寧波力勤資源科技股份有限公司(以下簡稱“力勤資源”)日前向港交所遞交上市申請書,擬登陸港股主板,中金公司、招銀國際為其聯席保薦人。
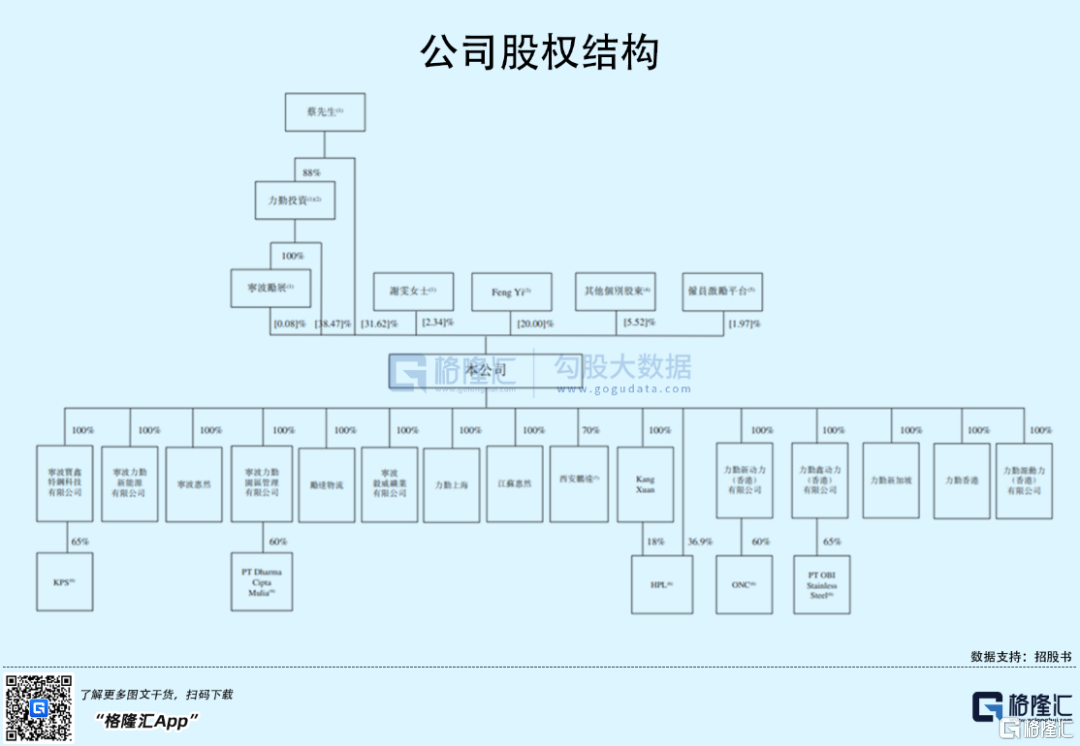
IPO前,蔡先生直接持股31.62%,通過力勤投資及其旗下寧波勵展間接控股,謝女士(蔡先生的配偶)持股2.34%,二人合計持股72.52%;Feng Yi直接持股20.00%。
1
國內最大的鎳礦貿易商
力勤資源成立於2009年,是一家鎳全產業鏈公司。其業務涵蓋了上游鎳資源整合、鎳產品貿易、冶煉生產、設備製造與銷售等在內的多個產業環節,產品廣泛地應用於新能源汽車、不鏽鋼等下游領域。
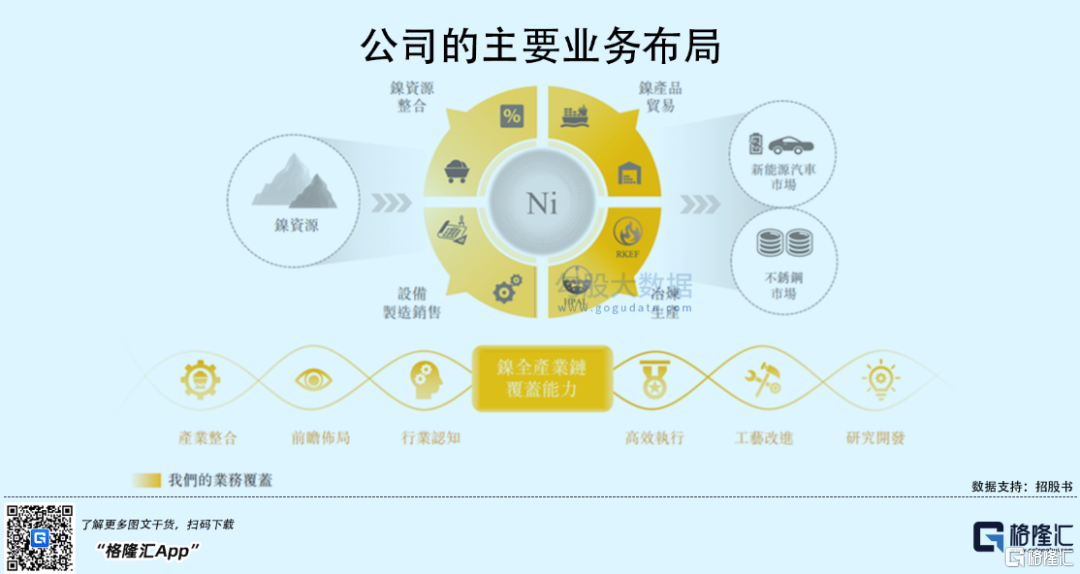
鎳是一種硬而有延展性並具有鐵磁性的金屬,主要用於新能源汽車三元電池,以及建築和機械的不鏽鋼。
2016年-2019年,全球鎳礦開採量由2.1百萬金屬噸穩步增長至2.6百萬金屬噸,2020年受新冠疫情的影響,全球鎳礦開採量有所減少,預計2021年將達到2.7百萬金屬噸。
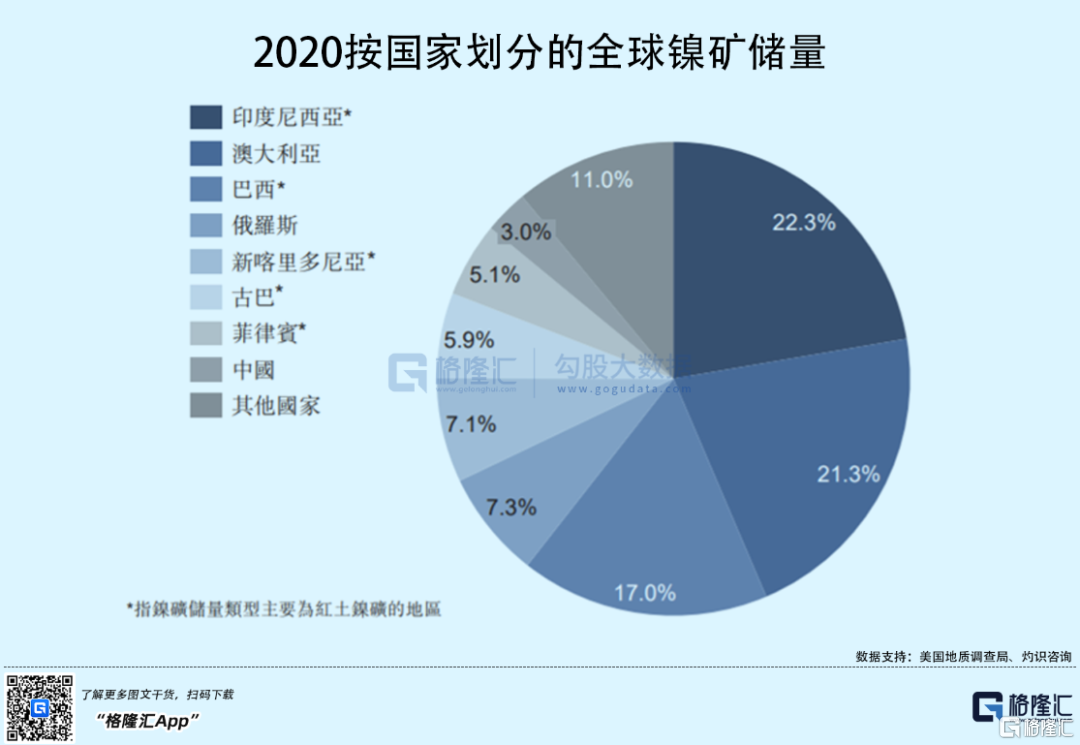
目前,全球鎳礦儲量主要集中在印度尼西亞、澳大利亞及巴西,截至2020年佔全球鎳礦儲量的60.6%。鎳開採主要國家包括印度尼西亞、菲律賓、俄羅斯及新喀里多尼亞。其中,印度尼西亞及菲律賓於2020年佔全球生產的40%以上。不過,2020年印度尼西亞禁止出口鎳礦後,全球鎳礦出口集中在了菲律賓。
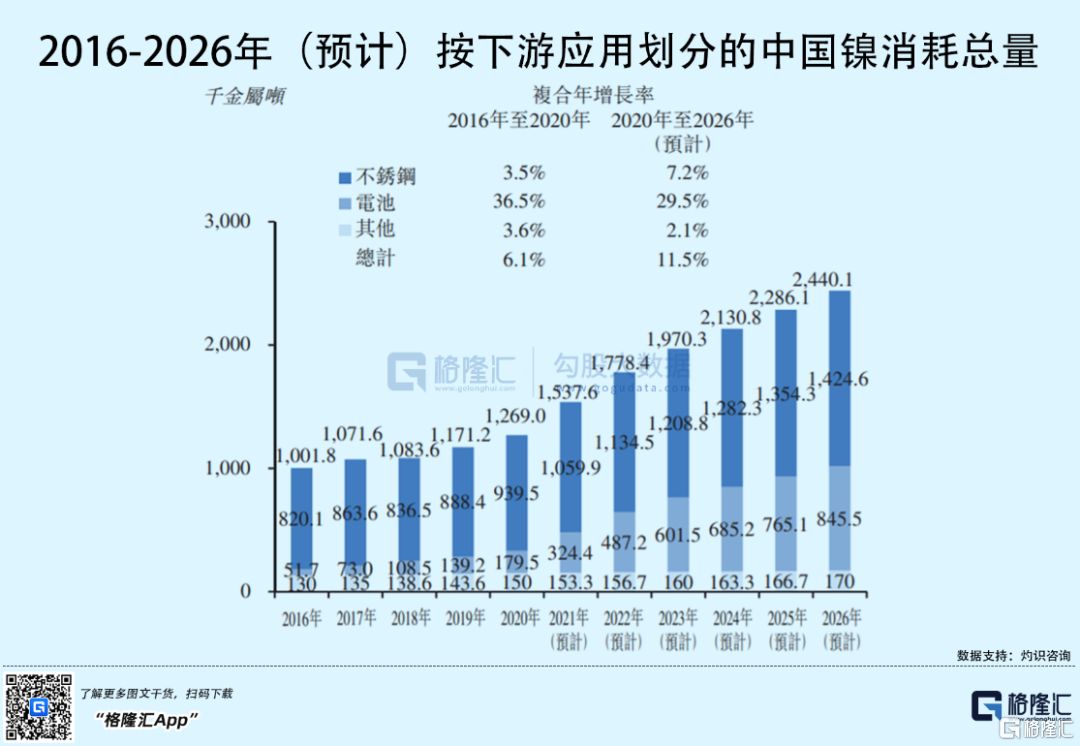
隨着鎳消耗量日益增加,全球鎳礦貿易量及消耗量不斷增加。全球鎳礦貿易量由2016年的41.7百萬噸增加至2019年的66.0百萬噸,複合年增長率為16.5%,2020年疫情之下,貿易量下降至47.5百萬噸,預計到2026年將重回增長至72.4百萬噸。全球鎳消耗量也由2016年的2122.0千金屬噸增加至2020年的2493.0千金屬噸,複合年增長率為4.1%。
由於中國鎳資源有限,因此消耗的超90%的鎳礦依賴貿易,目前已成為全球最大的鎳礦消耗國,佔全球鎳礦貿易量82.3%。
目前,力勤資源是中國最大的鎳礦貿易商,其2019年-2021年前三季度鎳礦貿易量均為中國第一,2020年的市場份額為27.3%。而在全球,其鎳礦貿易量也在2020年全球排名第四。
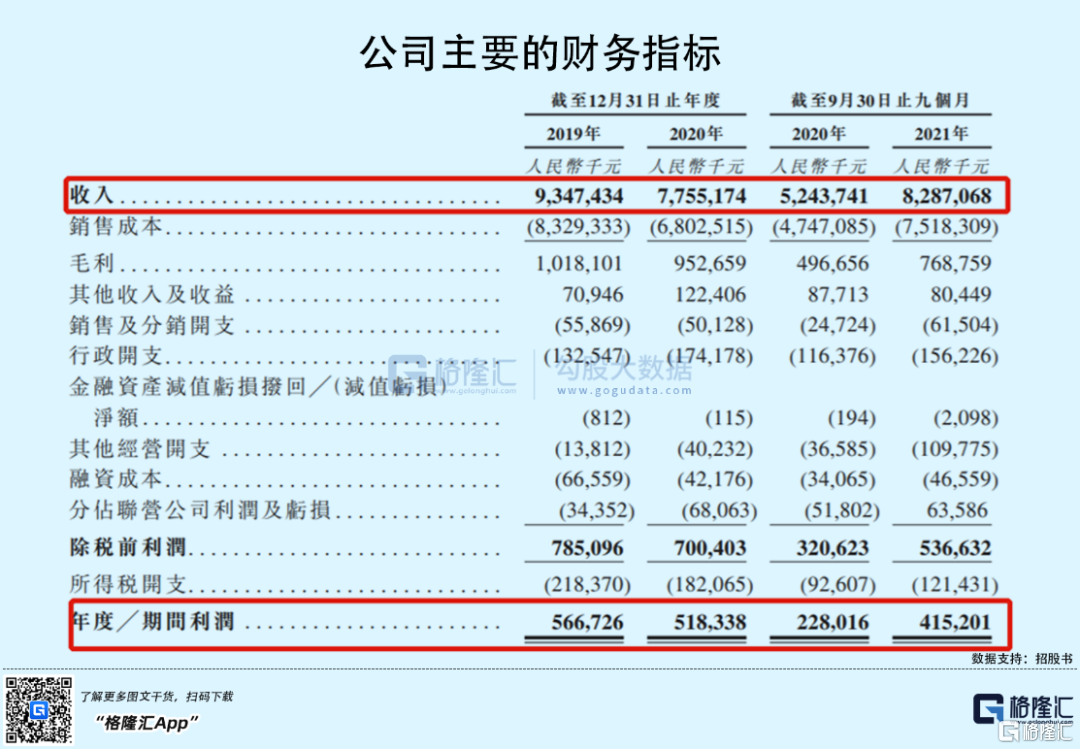
2020年受新冠疫情及印度實施出口禁令的影響,力勤資源的鎳產品貿易業務受到一定衝擊,其收入由2019年的93.47億元下降17%至77.55億元,同期淨利潤由5.67億元減少8.5%至5.18億元,2021年前三季度恢復增長。
儘管力勤資源收入規模體量較大,但其毛利率並不高,2019年-2021年前三季度分別為10.9%、12.3%、9.3%。
2
鎳礦資源依賴於海外國家
報吿期內,力勤資源的大部分收入來自於鎳產品貿易,包括紅土鎳礦、鎳鐵及鎳鈷化合物,收入佔比超6成。
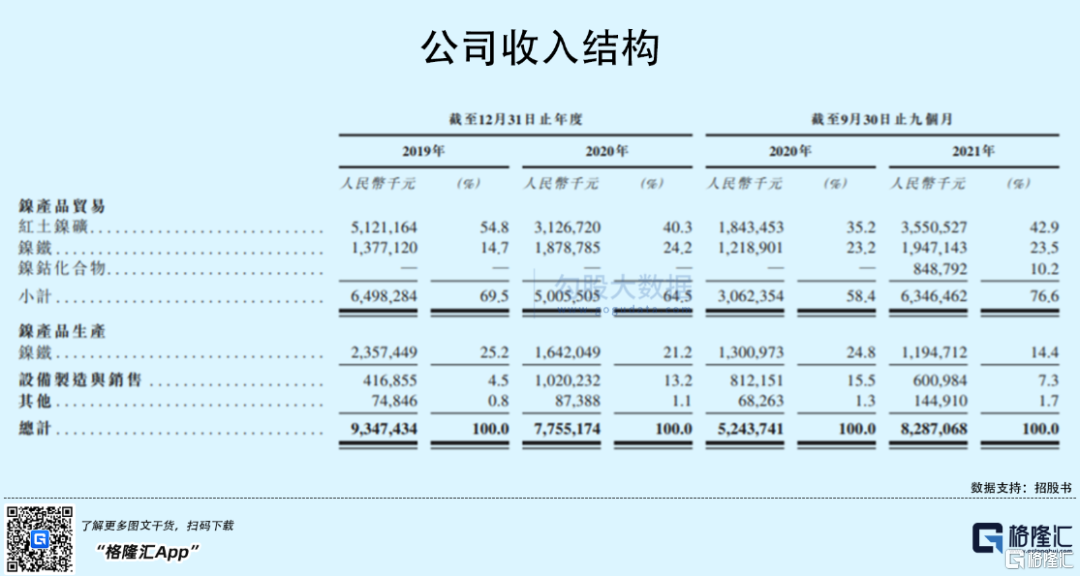
值得注意的是,公司的鎳礦資源主要依賴於海外國家,主要從菲律賓採購紅土鎳礦,從印度尼西亞採購鎳鐵,易受貿易政策及相關出口管制政策的影響,或將對公司經營業務造成一定影響。
此外,力勤資源業務運營需要大量資金支持,但過往來看,公司的現金流狀況並不樂觀。截至2019年-2021年9月底,公司的流動負債淨額分別為1.63億元、2.76億元及9.05億元,流動比率、速動比率呈現下滑態勢,且不足1倍。

3
小結
力勤資源作為國內最大的鎳產品貿易商,在國內乃至全球市場佔據一定市場地位,其業務及收入規模也受下游領域高景氣影響,取得一定成績。不過,由於公司在國內並未擁有鎳礦資源,而主要依賴海外進口採購,成本管控方面顯些被動,以至於公司毛利率處於較低水平。未來公司如何提升盈利能力,還有待考驗。
Follow us
Find us on
Facebook,
Twitter ,
Instagram, and
YouTube or frequent updates on all things investing.Have a financial topic you would like to discuss? Head over to the
uSMART Community to share your thoughts and insights about the market! Click the picture below to download and explore uSMART app!

Disclaimers
uSmart Securities Limited (“uSmart”) is based on its internal research and public third party information in preparation of this article. Although uSmart uses its best endeavours to ensure the content of this article is accurate, uSmart does not guarantee the accuracy, timeliness or completeness of the information of this article and is not responsible for any views/opinions/comments in this article. Opinions, forecasts and estimations reflect uSmart’s assessment as of the date of this article and are subject to change. uSmart has no obligation to notify you or anyone of any such changes. You must make independent analysis and judgment on any matters involved in this article. uSmart and any directors, officers, employees or agents of uSmart will not be liable for any loss or damage suffered by any person in reliance on any representation or omission in the content of this article. The content of the article is for reference only and does not constitute any offer, solicitation, recommendation, opinion or guarantee of any securities, virtual assets, financial products or instruments. Regulatory authorities may restrict the trading of virtual asset-related ETFs to only investors who meet specified requirements. Any calculations or images in the article are for illustrative purposes only.
Investment involves risks and the value and income from securities may rise or fall. Past performance is not indicative of future performance. Please carefully consider your personal risk tolerance, and consult independent professional advice if necessary.


