漲停潮來襲,大基建還能發力多久?
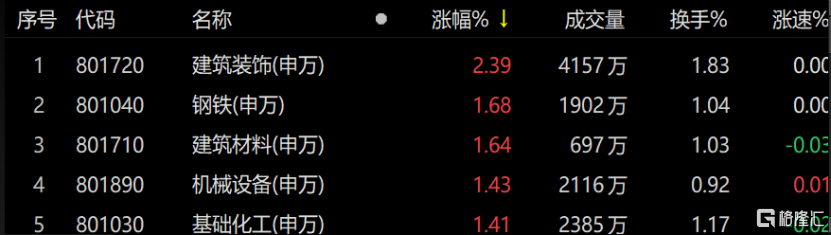
回調數日後,大基建板塊今日又見大漲行情。申萬建築裝飾、鋼鐵、建築材料、機械設備等領漲大盤。
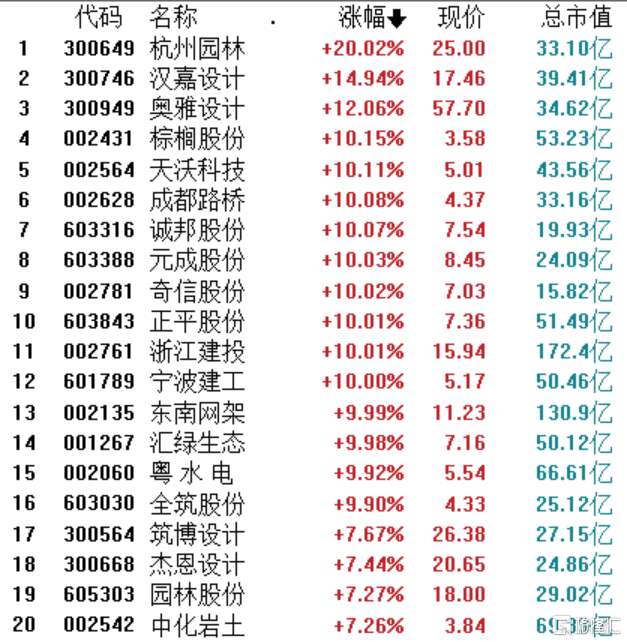
個股方面,杭州園林、漢嘉設計、奧雅設計、成都路橋、浙江建投、全築股份等16支基建股漲停封板。其中,杭州園林已經連續兩天飆漲20%,從1月低位至今累漲約73.5%。浙江建投更是在8個交易日內狂拉7個漲停板。
今日大基建板塊的全線大漲行情,主要是受兩大消息刺激所致。一是日前國務院常務會議上關於基礎設施建設的利好消息,二是今日公佈的CPI與PPI數據。
日前國常會上強調,推進製造業強鏈補鏈和產業基礎再造,加快新型基礎設施建設、重點領域節能降碳技術改造等,擴大有效投資。
去年底,中央經濟工作會議上明確經濟重心迴歸“穩增長”主基調,指出當前國內經濟發展面臨臨“需求收縮、供給衝擊、預期轉弱”三重壓力,今年經濟工作要穩字當頭,並提出基建可“適度超前投資”。
目前,財政部已提前下達2022年新增地方政府債務限額17880億元。其中,一般債務限額3280億元,專項債務限額14600億元。新增地方債務限額到位,也給大基建板塊資金增持帶來了信心。
今日上午,國家統計局發佈中國1月CPI與PPI數據。數據顯示,今年1月,PPI(全國工業生產者出廠價格)同比上漲9.1%,前值為10.3%,漲幅環比回落1.2個百分點。PPI增速連續三個月下滑,創下去年7月以來新低。今年1月CPI(全國居民消費價格)同比上漲0.9%,前值為1.5%,漲幅環比回落0.6個百分點。
CPI與PPI環比增速下滑,結合此前公佈的1月份社融數據,也從側面反映目前國內的經濟仍然較為疲軟。
上週,央行發佈1月社融數據,社會融資規模存量為320.05萬億元,同比增長10.5%;增量為6.17萬億元,比上年同期多9842億元,遠超市場預期。但從社融結構上來看,依然存在失衡情況。
政府債券與人民幣貸款是此次社融數據超預期的支撐主力,而表外融資的速度整體放緩。代表企業信貸意願的中長期貸款與票據融資均不及預期,實體經濟恢復並不如想象中樂觀。居民貸款更是出現了同比少增的情況,成為社融數據中拖後腿的一項。
當前,全球通脹高企,海外國家如美國等物價指數連創新高。但國內的物價運行卻較為平穩,為減少國內企業在原材料上遇到的壓力,在輸入型通脹方面,控制力度較好,這也為國家進一步實施較為寬鬆的貨幣政策與財政政策提供了一定基礎。
在當前經濟恢復緩慢,消費不振與企業投資意願較低的情況下,基建適度超前投資只是一味穩住經濟增長的藥,並不可長久持續。目前,市場正處於業績空窗期,政策的引導給予了基建股較大的發揮空間。如果經濟開始企穩,對於大基建而言,“穩增長”的利用價值便不大了。
比如,今日出現連板的多數是一些流通市值較小的個股,而中字頭的幾家如中國電建等,仍然處於震盪上行的狀態,難以突破此前的高點位置,資金承接力量較弱。昨日至今部分賽道股的抬頭修復,也表明市場中仍然有部分資金此前只是暫時離開成長股賽道,對於成長股賽道仍然抱有期待。
這也意味着,市場中的資金在高低切的同時,也在觀望,今年市場中的主線到底是什麼?更多的提示,可能還是需要等到今年3月份兩會的召開,才能知曉。但市場終究是靠參與其中的人共同走出來的,就如同去年兩會提出的新能源,也是在去年一點一點靠市場靠業績驗證得出的。今年特殊的經濟轉型環境下,只是市場的迷茫時間更長了。
Follow us
Find us on
Facebook,
Twitter ,
Instagram, and
YouTube or frequent updates on all things investing.Have a financial topic you would like to discuss? Head over to the
uSMART Community to share your thoughts and insights about the market! Click the picture below to download and explore uSMART app!

Disclaimers
uSmart Securities Limited (“uSmart”) is based on its internal research and public third party information in preparation of this article. Although uSmart uses its best endeavours to ensure the content of this article is accurate, uSmart does not guarantee the accuracy, timeliness or completeness of the information of this article and is not responsible for any views/opinions/comments in this article. Opinions, forecasts and estimations reflect uSmart’s assessment as of the date of this article and are subject to change. uSmart has no obligation to notify you or anyone of any such changes. You must make independent analysis and judgment on any matters involved in this article. uSmart and any directors, officers, employees or agents of uSmart will not be liable for any loss or damage suffered by any person in reliance on any representation or omission in the content of this article. The content of the article is for reference only and does not constitute any offer, solicitation, recommendation, opinion or guarantee of any securities, virtual assets, financial products or instruments. Regulatory authorities may restrict the trading of virtual asset-related ETFs to only investors who meet specified requirements. Any calculations or images in the article are for illustrative purposes only.
Investment involves risks and the value and income from securities may rise or fall. Past performance is not indicative of future performance. Please carefully consider your personal risk tolerance, and consult independent professional advice if necessary.


