You are browsing the Hong Kong website, Regulated by Hong Kong SFC (CE number: BJA907). Investment is risky and you must be cautious when entering the market.
上市首日差點坐過山車,誠達藥業未來預期還能看好嗎?
格隆匯 01-20 17:18

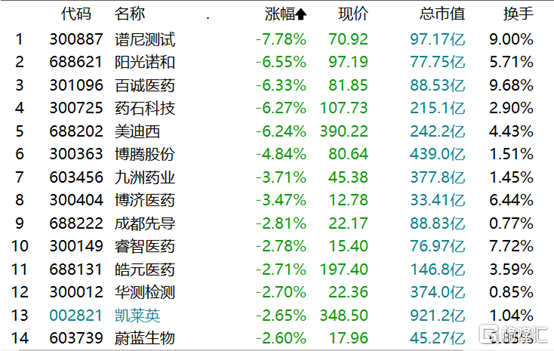
今日盤面,CXO板塊整體繼續下跌,美迪西、藥石科技、博騰股份跌近7%,凱萊英、康龍化成也紛紛走弱。

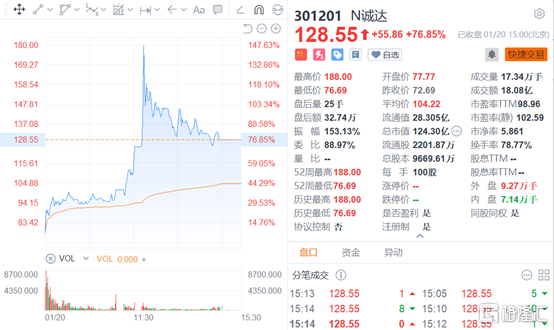
但是,今日首次登陸創業板的概念股誠達藥業卻表現強勁,盤中衝高大漲至188元,一度觸發臨時停牌,最高漲幅達到158.63%。

截至收盤,股價回落至128.55元,全天換手率達到78.77%。

資料顯示,誠達藥業主要致力於為跨國製藥企業及醫藥研發機構提供關鍵醫藥中間體CDMO服務,並從事左旋肉鹼系列產品的研發、生產和銷售。

截至前三季度,公司實現營業收入2.89億元,同比增長8.58%,實現歸母淨利潤0.7億元,同比增長6.65%。

由於2020年公司衡山路老廠區處置導致資產處置收益較高,2021年全年業績有所下滑。

預計2021年實現歸母淨利潤1.03-1.05億元,同比下降13.14%-15.04%,預計扣非後歸母淨利潤為1-1.02億元,同比增長18.30%-21.02%。

公司主要收入來源是CDMO服務和左旋肉鹼產品,分別佔比43%、50%左右。

公司是國內最早實現左旋肉鹼系列產品產業化的企業之一,2018-2020年全球市場佔有率分別為9.45%、10.67%以及14.25%。

其主要產品左卡尼汀先後通過美國FDA、國內藥品註冊、GMP 符合性等現場檢查,已建立良好的國際知名度,是全球左旋肉鹼系列產品的主要供應商之一。

但是左旋肉鹼行業競爭格局基本已經穩定,市場規模也不會有大的增長,機構預測2019-2027年的年複合增長率不到5%。

目前公司的看點就在CDMO業務上,根據F&S統計,全球CDMO市場規模從2014年的178億美元增加到了2018年的268億美元,預計到2023年全球CDMO市場規模將增至518億美元,年均複合增長率達到14.10%。

歐美國家的CDMO企業歷史悠久,生產工藝、設備先進性及管理能力均處於世界領先水平,而國內CDMO企業由於發展時間較短,目前國內CDMO行業佔全球市場份額相對較低。

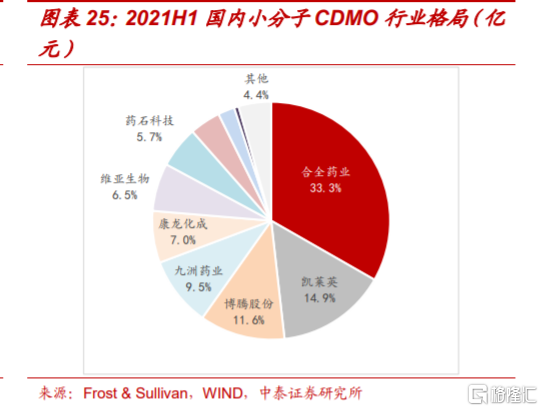
國內做CDMO的上市公司有藥明康德、凱萊英、博騰股份、九洲藥業、諾泰生物等。

以藥明康德為例,對比弗若斯特沙利文全球小分子CDMO行業市場規模,2020年藥明康德的市佔率不足3%。

不過國內藥企有着低成本的優勢,海外CDMO訂單不斷加速向中國轉移。

從交付形態來看,誠達藥業的CDMO服務成果主要以醫藥中間體、原料藥等產品形式交於客户,與同行業基本一致,符合行業慣例。

但由於資金實力欠缺、融資渠道單一等因素的限制,當前誠達藥業的CDMO業務規模與國內已上市的CDMO企業存在較大差距,目前佔據國內市場份額不到1%。

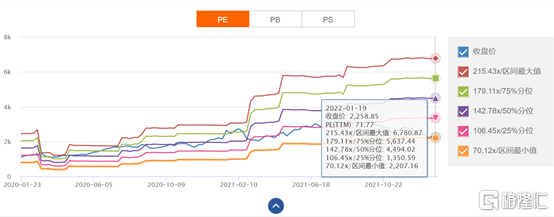
目前整個CXO板塊平均市盈率為70.2倍,較2021年初至今平均PE下降近一半。

其中DEL平台藥篩龍頭成都先導PE為112倍,臨牀前龍頭美迪西PE為102倍,CDMO龍頭凱萊英PE為101倍。

誠達藥業發行價為72.69元,發行市盈率83.1倍,截至今日收盤股價為128.55元,對於市盈率為98.99倍。

從基本面來看,公司雖然在左旋肉鹼業務方面有一定的市場地位,但這個行業未來增速已經明顯放緩,而CDMO業務方面,在國內市場份額佔比一直都較為微薄,未來能否搶佔更多市場份額,還有待考察。

鑑於目前該公司業務業績所對應的估值水平已經和行業不相上下,未來還需注意估值調整的風險。

Follow us
Find us on Facebook, Twitter , Instagram, and YouTube or frequent updates on all things investing.Have a financial topic you would like to discuss? Head over to the uSMART Community to share your thoughts and insights about the market! Click the picture below to download and explore uSMART app!
Disclaimers
uSmart Securities Limited (“uSmart”) is based on its internal research and public third party information in preparation of this article. Although uSmart uses its best endeavours to ensure the content of this article is accurate, uSmart does not guarantee the accuracy, timeliness or completeness of the information of this article and is not responsible for any views/opinions/comments in this article. Opinions, forecasts and estimations reflect uSmart’s assessment as of the date of this article and are subject to change. uSmart has no obligation to notify you or anyone of any such changes. You must make independent analysis and judgment on any matters involved in this article. uSmart and any directors, officers, employees or agents of uSmart will not be liable for any loss or damage suffered by any person in reliance on any representation or omission in the content of this article. The content of the article is for reference only and does not constitute any offer, solicitation, recommendation, opinion or guarantee of any securities, virtual assets, financial products or instruments. Regulatory authorities may restrict the trading of virtual asset-related ETFs to only investors who meet specified requirements. Any calculations or images in the article are for illustrative purposes only.
Investment involves risks and the value and income from securities may rise or fall. Past performance is not indicative of future performance. Please carefully consider your personal risk tolerance, and consult independent professional advice if necessary.
uSMART
Wealth Growth Made Easy
Open Account