2021年出口份額為何中國和韓國回升,越南迴落?
本文來自格隆匯專欄作家:陶川
2021年對於中國出口又是驚喜的一年,全年出口增長29.9%,繼續在全球主要出口國家中領跑。如此亮眼的出口增速一方面得益於全球貿易的復甦,比如2021年前三季度全球商品出口增速達到了28.6%;另一方面也得益於中國出口商在全球繼續搶佔市場份額,比如從最新的數據來看,2021年1-9月中國在全球商品出口的份額為15.0%,較2020年的14.9%進一步回升。
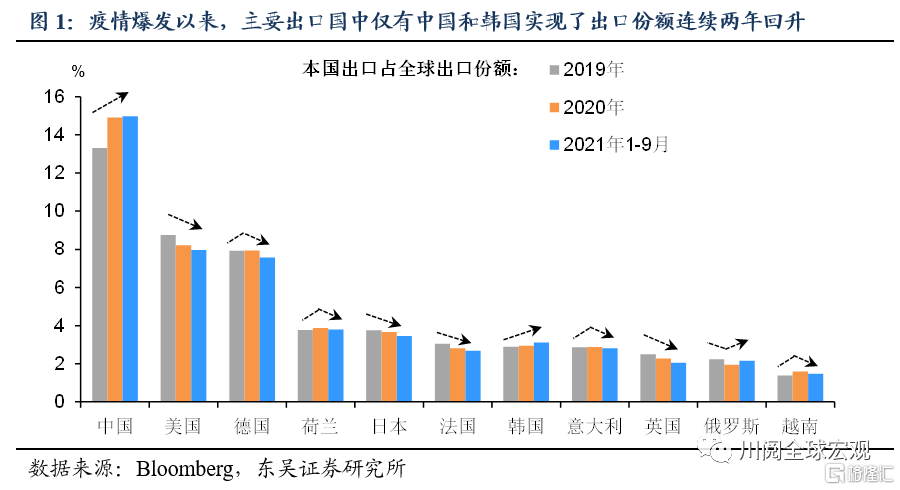
從全球主要出口國的市場份額來看,如圖1所示,疫情爆發以來其出口份額的變化可以分為四類:一是持續回升,僅有中國和韓國;二是持續下降,如美國、日本、法國、英國;三是先升後降,如德國、荷蘭、意大利、越南;四是先降後升,僅有俄羅斯。
由於疫情反覆下的供應鏈恢復受阻,主要發達國家出口國市場份額的持續下降可以理解,而在油價上漲背景下俄羅斯出口份額的回升也在情理之中,但令人意外的是,為何此前一度認為可能在疫情後搶走中國外貿訂單的越南,為何在2021年出口的市場份額反而回落了?
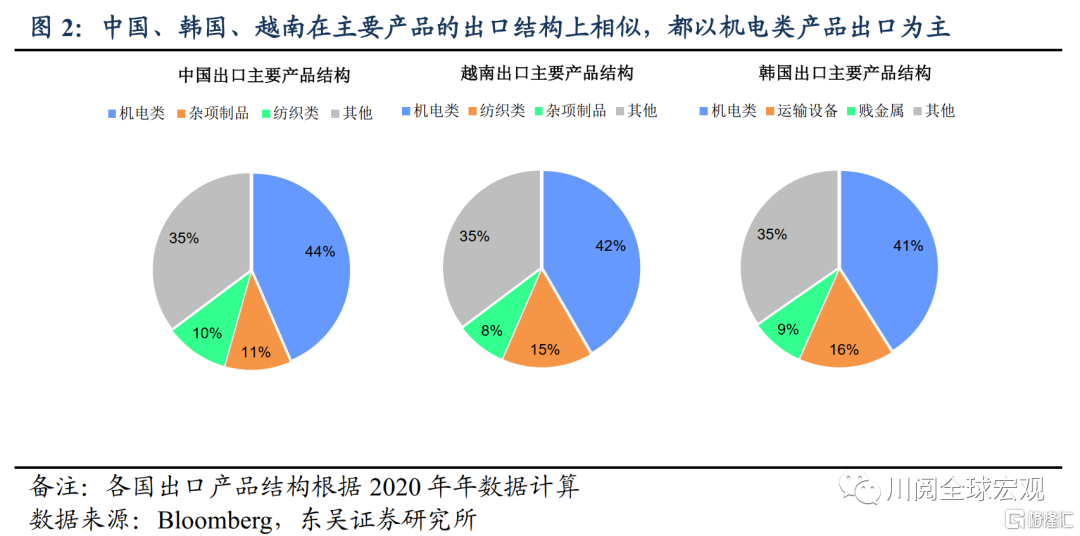
從主要產品的結構來看,中國和越南較為相似,都以機電類和紡織類出口為主。其中機電類產品佔據了近半壁江山(2020全年分別為44%、42%),另一個出口大國韓國也是如此,機電類產品2020全年佔比為41%(圖2)。
但從機電類產品的細分結構來看,2020全年越南的手機類產品出口佔比達到了51%,而中國的手機出口佔比僅為21%,在其他產品的分佈上也更為均衡(圖3)。由此可見,由於過於依賴手機出口,2021年在全球“缺芯”的背景下,越南的出口所受的供給衝擊最為明顯,而中國在各類產品產業鏈上相對完整的優勢則得以顯現。
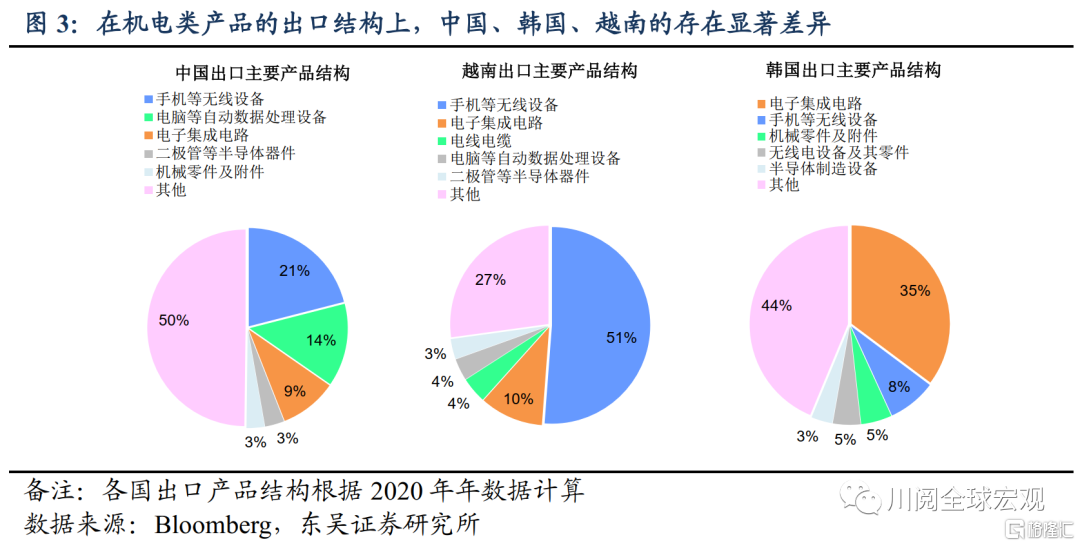
2021年中國和韓國出口份額的回升也受益於其相對複雜的產品結構。從出口產品複雜性指數來看,韓國(2.05)>中國(1.35)>越南(0.05),尤其是韓國電子集成電路的出口,其在韓國機電類出口的佔比超過了三分之一,得益於其在該產品上的技術壁壘,電子集成電路出口成為韓國出口份額在2021年回升的主要支撐。
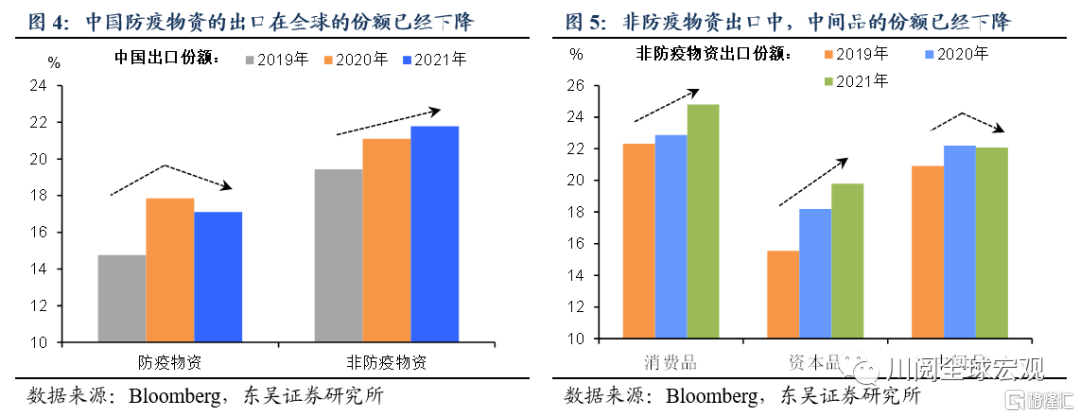
往後來看,我們觀察中國2022年出口份額變化的關鍵在消費品和資本品出口。如圖4所示,2021年中國防疫物資出口的市場份額明顯下滑,已經中國出口份額的回升主要依賴於非防疫物資出口;而在非防疫物資出口中,中間品的市場份額已經下滑,主要靠消費品和資本品出口份額的回升在支撐(圖5)。
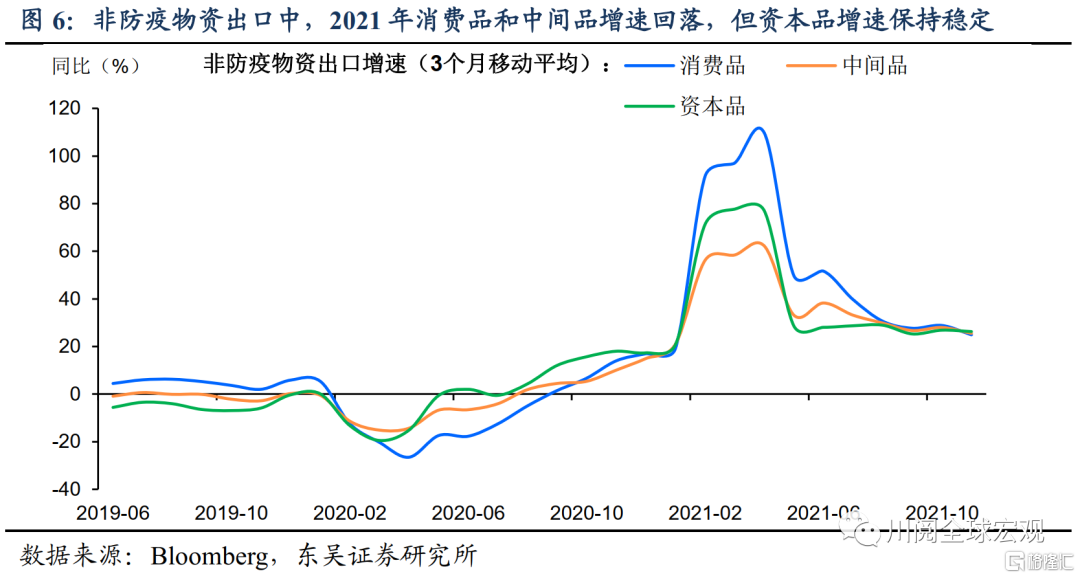
2021年非防疫物資出口中,資本品出口的增速一直保持穩定,有望成為2022年中國出口的主要支撐。如圖6所示,2021年以來消費品和中間品出口的增速明顯回落,但資本品出口相對穩定,鑑於發達國家以美國為代表的居民商品消費已經見頂,但企業資本支出尚未回到疫情前的趨勢,我們認為在補庫存和新一輪的資本開支週期下,中國資本品的出口將成為2022年出口的亮點。
風險提示:疫情擴散超預期,政策對沖經濟下行力度不及預期
Follow us
Find us on
Facebook,
Twitter ,
Instagram, and
YouTube or frequent updates on all things investing.Have a financial topic you would like to discuss? Head over to the
uSMART Community to share your thoughts and insights about the market! Click the picture below to download and explore uSMART app!

Disclaimers
uSmart Securities Limited (“uSmart”) is based on its internal research and public third party information in preparation of this article. Although uSmart uses its best endeavours to ensure the content of this article is accurate, uSmart does not guarantee the accuracy, timeliness or completeness of the information of this article and is not responsible for any views/opinions/comments in this article. Opinions, forecasts and estimations reflect uSmart’s assessment as of the date of this article and are subject to change. uSmart has no obligation to notify you or anyone of any such changes. You must make independent analysis and judgment on any matters involved in this article. uSmart and any directors, officers, employees or agents of uSmart will not be liable for any loss or damage suffered by any person in reliance on any representation or omission in the content of this article. The content of the article is for reference only and does not constitute any offer, solicitation, recommendation, opinion or guarantee of any securities, virtual assets, financial products or instruments. Regulatory authorities may restrict the trading of virtual asset-related ETFs to only investors who meet specified requirements. Any calculations or images in the article are for illustrative purposes only.
Investment involves risks and the value and income from securities may rise or fall. Past performance is not indicative of future performance. Please carefully consider your personal risk tolerance, and consult independent professional advice if necessary.


