You are browsing the Hong Kong website, Regulated by Hong Kong SFC (CE number: BJA907). Investment is risky and you must be cautious when entering the market.
到期日逼近!高企的恐慌指數意味着什麼?
格隆匯 12-22 17:13

本文來自:金十數據, 作者:暴走老黎

週三將是VIX期貨和期權的到期日,與上個月相比,當前市場對未來的波動率押注高了不止一點半點。

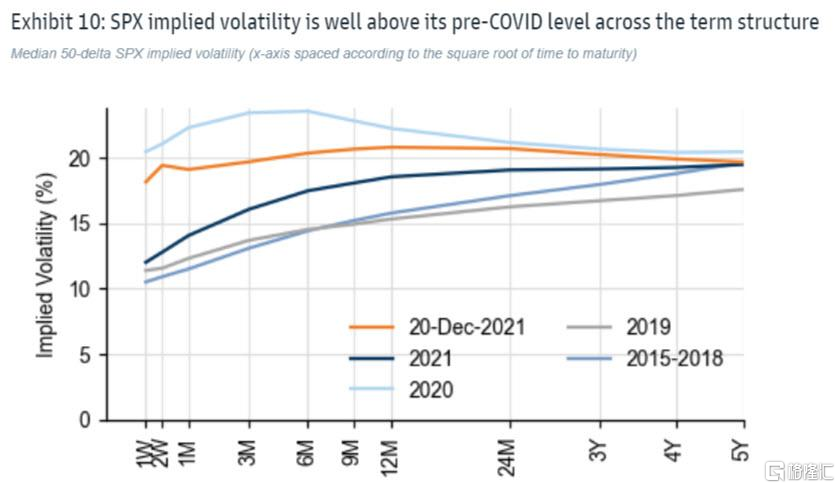
SpotGamma指出,市場正以更高的VIX結構進入VIX的到期日。與11月相比,當前的VIX期限結構更高,從下圖可以看到,當前水平(黑色)遠高於11月的水平(藍色)。

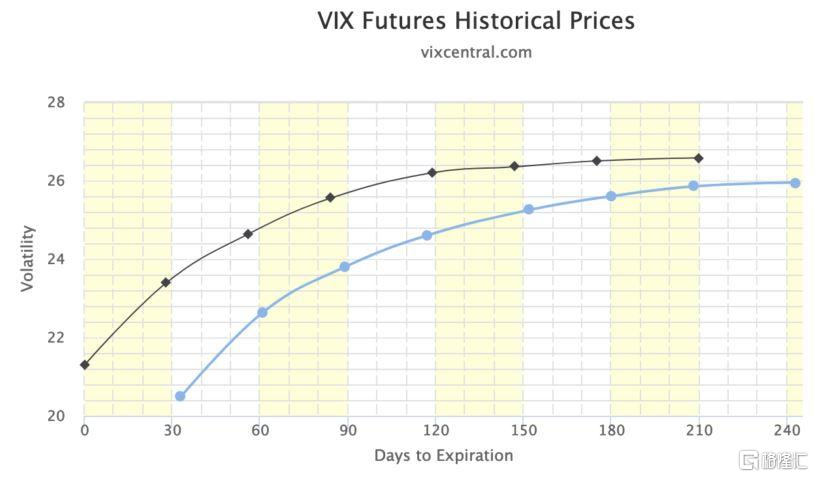
由於在11月時市場還沒開始擔憂奧密克戎毒株和美聯儲緊縮,因此當前VIX的上漲是合理的,但分析師擔心,隨着到期日的到來,交易員移倉換月可能會拖低當前的股市價格。

雖然上週“四巫日”已過,短期波動率可能會下降,但高盛的Rocky Fishman指出,市場定價顯示,2022年波動性將增加。

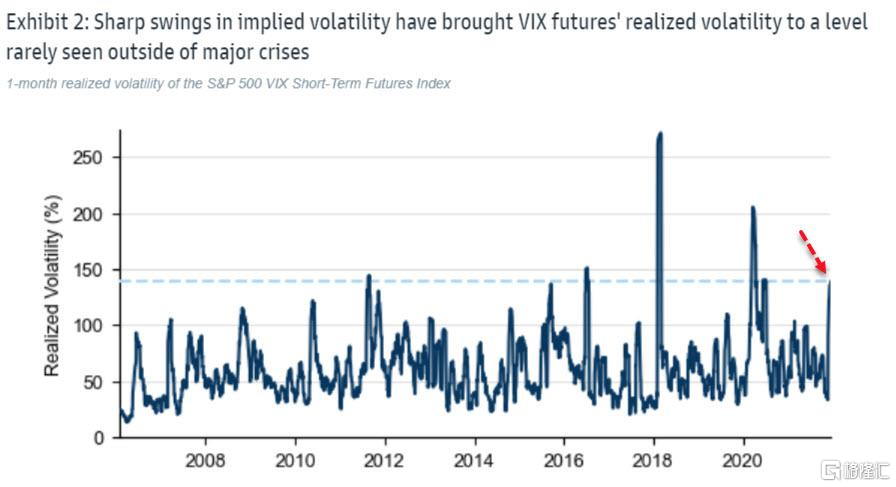
在2021年的最後幾周裏,股市波動性大幅變化,VIX期貨的波動率非常高,這也是今年全年的特點,在2021年裏,實際波動率劇烈震盪。

就全年而言,標普500指數的實際波動率略高於2019年疫情之前的水平,但衍生品市場的看法有所不同,投資者的避險情緒導致隱含波動率遠高於疫情之前的範圍。

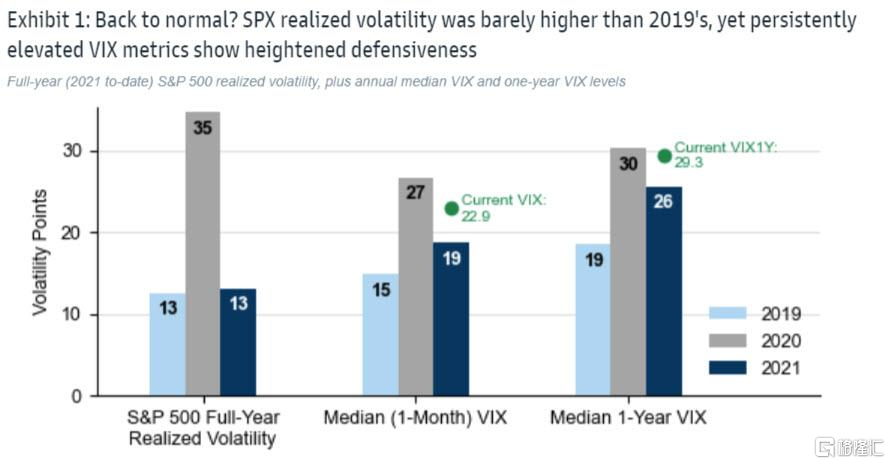
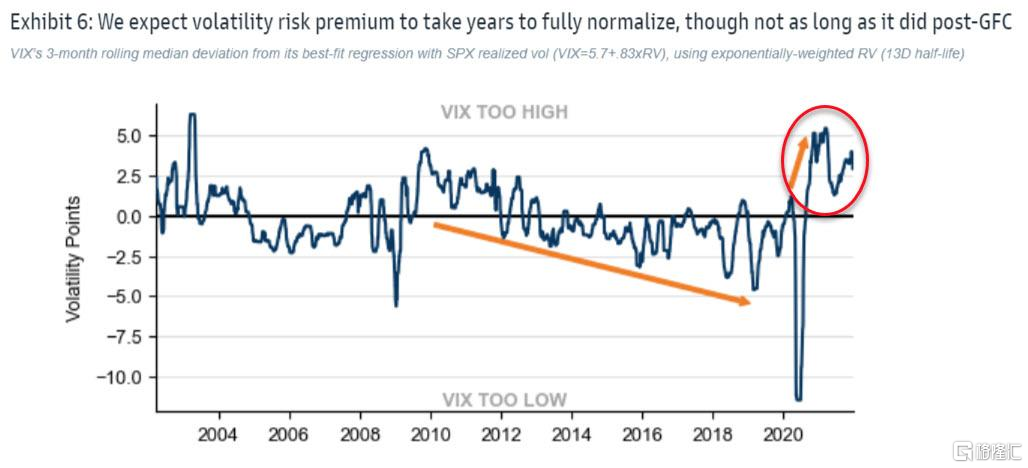
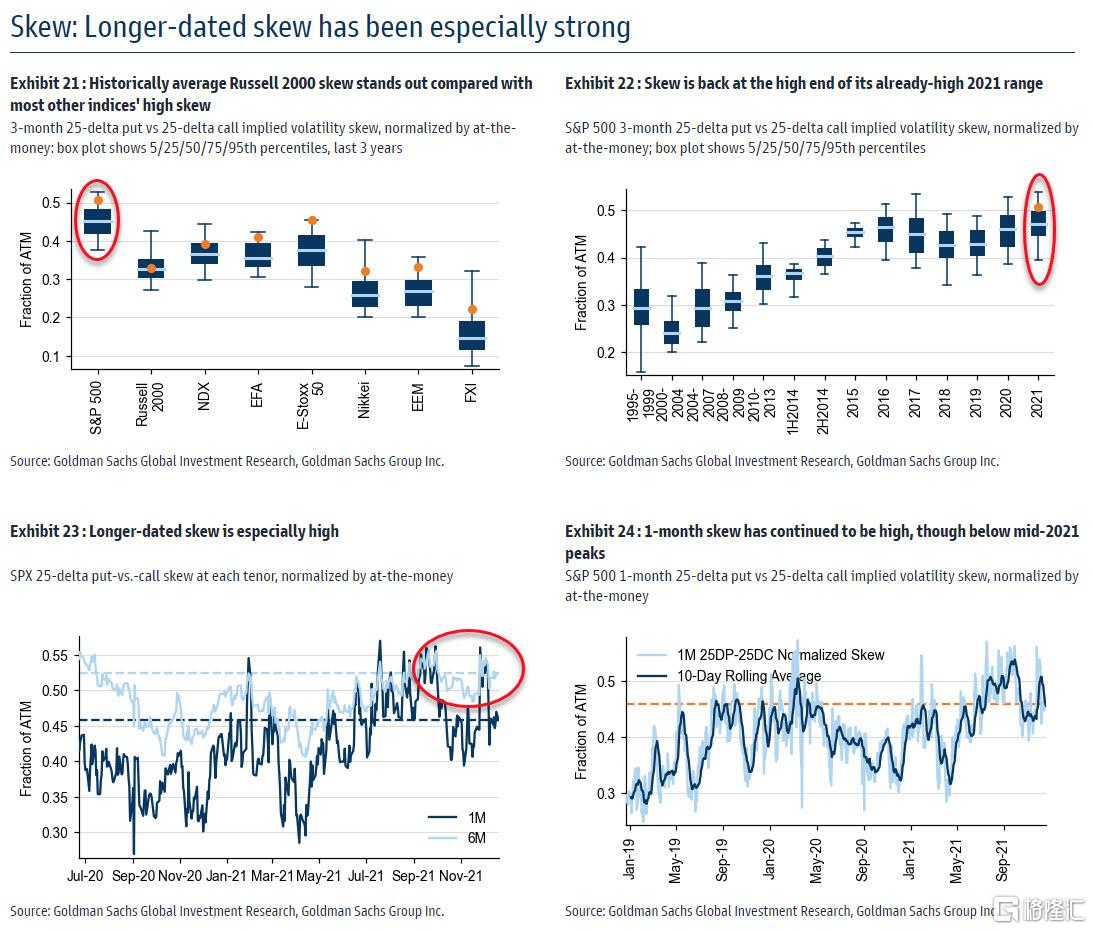
另外,許多skew偏斜指標(如標普500指數和歐洲斯托克指數的25-delta風險逆轉指標)和波動率風險溢價指標(如VIX減去13天期指數的實際波動率)在2021年的中值水平均創下歷史新高。

這些風險規避指標高企,主要是由於投資者押注波動率可能會重返2020年的水平,而並不是因為恐慌性購買的浪潮。

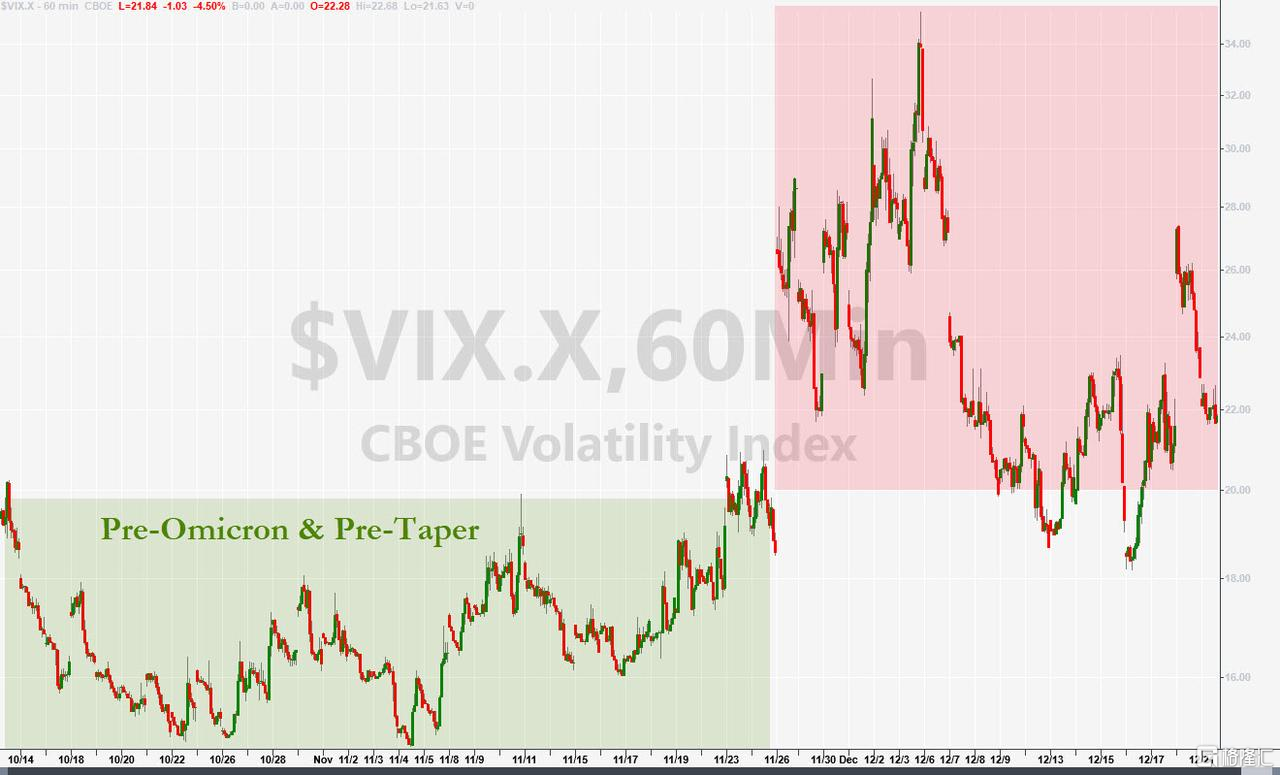
隨着市場消化奧密克戎變異株、美聯儲加速Taper以及拜登支出法案的消息,標普500指數的隱含波動率出現了劇烈波動。週一,波動率指數從十幾飆升到30後,再重新跌回10以上,最終回到了27以上的高位。另外,做多VIX期貨的策略的1個月實際波動率超過了過去15年裏大部分時間(98%)的水平。

波動性的急劇波動反映了投資者試圖權衡兩大趨勢誰更強勢,一是流動性減弱的可能性,且系統性基金的拋售推高波動性並促使進一步拋售;二是將實際波動性推回到2021年中期低點的關鍵催化劑預計將更加清晰。

總的來説,Fishman預計,2022年實際波動率將適度上升,主要原因是宏觀市場中標普500指數的內部相關性增加,但這應該不足以將實際波動率推高至當前隱含波動率的水平。

到2022年初,預計通脹軌跡和美聯儲首次加息的時間的不確定性將減弱,但投資者對經濟數據的敏感程度會更高。另外,美國中期選舉將成為重點關注的事件。

在高盛看來,這種緩解將繼續有利於賣出期權的策略,波動性的風險溢價將成為做多波動率策略的阻力因素。因此,未來可以期待更多的逢低買入和V型復甦,直到做空波動率溢價無利可圖為止。

Follow us
Find us on Facebook, Twitter , Instagram, and YouTube or frequent updates on all things investing.Have a financial topic you would like to discuss? Head over to the uSMART Community to share your thoughts and insights about the market! Click the picture below to download and explore uSMART app!
Disclaimers
uSmart Securities Limited (“uSmart”) is based on its internal research and public third party information in preparation of this article. Although uSmart uses its best endeavours to ensure the content of this article is accurate, uSmart does not guarantee the accuracy, timeliness or completeness of the information of this article and is not responsible for any views/opinions/comments in this article. Opinions, forecasts and estimations reflect uSmart’s assessment as of the date of this article and are subject to change. uSmart has no obligation to notify you or anyone of any such changes. You must make independent analysis and judgment on any matters involved in this article. uSmart and any directors, officers, employees or agents of uSmart will not be liable for any loss or damage suffered by any person in reliance on any representation or omission in the content of this article. The content of the article is for reference only and does not constitute any offer, solicitation, recommendation, opinion or guarantee of any securities, virtual assets, financial products or instruments. Regulatory authorities may restrict the trading of virtual asset-related ETFs to only investors who meet specified requirements. Any calculations or images in the article are for illustrative purposes only.
Investment involves risks and the value and income from securities may rise or fall. Past performance is not indicative of future performance. Please carefully consider your personal risk tolerance, and consult independent professional advice if necessary.
uSMART
Wealth Growth Made Easy
Open Account