華虹半導體收入再創新高,股價竟轉跌,發生了什麼?
今日午間,華虹半導體披露2021年三季度報吿,業績表現優異,但股價卻反其道而行,午後衝高回落,一度跌超6%,到底發生了什麼?

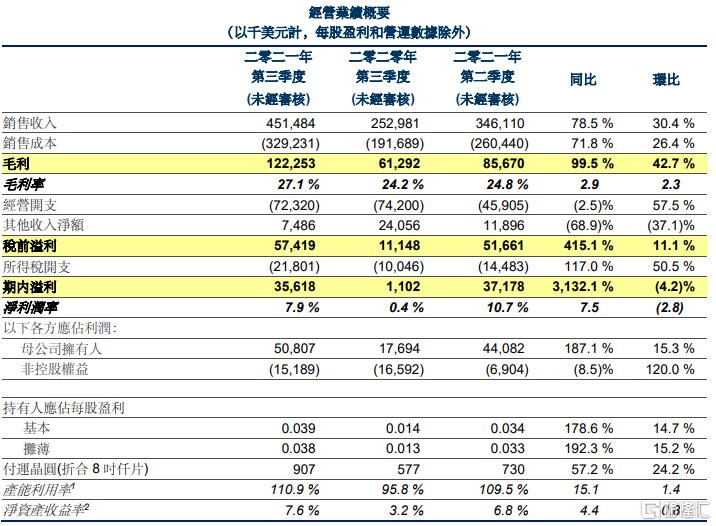
先看這份成績單,2021年第三季度,華虹半導體銷售收入創下了歷史新高,達4.515億美元,同比上升78.5%,環比上升30.4%。單三季度税前溢利5,080萬美元,超市場預估的4490萬美元。

從2020年1季度以來的營收增長情況看,公司業務快速增長趨勢明確,説明公司確實收穫了同期市場“芯片荒”的需求爆發紅利。
盈利能力方面,華虹半導體毛利率同比提升2.9個百分點至27.1%,實現淨利潤3561.8萬美元,淨利率同比提升7.5個百分點,但環比下滑了2.8個百分點至11.3%,對於淨利的下滑,華虹半導體解釋“主要由於一項一次性公司間交易致所得税開支增加。”
從地域市場來看華虹半導體的業績情況,受益於半導體行業國產替代加速,華虹半導體中國區銷售持續放量,於第三季度銷售收入達3.31億美元,較去年同期實現翻倍增長,增速遠超其他地域市場。美國及歐洲地區增量也較好,但整體規模依然偏小。

從晶圓產品工藝技術來看,55nm及65nm工藝技術節點的產能開始釋放,銷售收入劇增,三季度銷量同比提升6663.7%,90nm及95nm工藝的產品同步也氾濫大增2.6倍,成為業績增量的主力軍。

銷量暴增的背後,是華虹半導體火力全開的產能。面對幾乎所有細分市場的強勁需求,華虹半導體產能利用率也創下新高,本季度200mm及300mm晶圓廠的產能利用率分別達112.3%及108.7%,同比、環比均有所提升,總體產能利用率更是突破至110.9%。

同時,12吋的晶圓生產線也在快速釋放產能,三季度累計實現收入1.367億美元,同比增長7.23倍。
對於如此火爆的業務情況,華虹半導體管理層表示,“該季度是公司歷史上表現最為強勁的一個季度,幾乎所有細分市場都有強勁的需求,尤其是MCU、電源管理、IGBT、超級結、CIS和邏輯及射頻。”並預計“公司將迎來前所未有的機遇和成長,不僅 2021 年必將迎來公司有史以來最高的銷售額、最大的成長幅度,而且將在 2022 年繼續迅速成長、續寫輝煌篇章!“
不過,這一份業績數據也透露出了一些令市場擔心的“蛛絲馬跡”。首先三季報的業績雖然增長迅猛,但淨利潤增速卻出現了有所放緩的跡象。同時,根據公司披露的四季度業績指引,2021年四季度毛利率在27%至28%之間。雖然相對來説仍是處於高位,但相對三季度的毛利率高增長環比數據,意味着四季度毛利率難以繼續抬升,反應的是產品提價空間缺乏。
公司預計四季度銷售收入約4.9億美元,對比三季度的4.515億美元,銷售收入環比提升大約在8.5%,相較於三季度的30.4%也是大幅放緩增速,考慮到三季度淨利潤已經出現環比下滑的情況,這不免給市場之前對該公司未來繼續滿懷期待的熱情潑了一盤冷水,所以當中午業績公佈,股價上演高空跳水似乎也在情理之中。
但總體上,華虹半導體的這一份業績確實稱得上好成績,四季度的業績增速即使有可能放緩,也能不代表公司的業績增量消失,整體上公司還是會繼續穩健發展下去的。
Follow us
Find us on
Facebook,
Twitter ,
Instagram, and
YouTube or frequent updates on all things investing.Have a financial topic you would like to discuss? Head over to the
uSMART Community to share your thoughts and insights about the market! Click the picture below to download and explore uSMART app!

Disclaimers
uSmart Securities Limited (“uSmart”) is based on its internal research and public third party information in preparation of this article. Although uSmart uses its best endeavours to ensure the content of this article is accurate, uSmart does not guarantee the accuracy, timeliness or completeness of the information of this article and is not responsible for any views/opinions/comments in this article. Opinions, forecasts and estimations reflect uSmart’s assessment as of the date of this article and are subject to change. uSmart has no obligation to notify you or anyone of any such changes. You must make independent analysis and judgment on any matters involved in this article. uSmart and any directors, officers, employees or agents of uSmart will not be liable for any loss or damage suffered by any person in reliance on any representation or omission in the content of this article. The content of the article is for reference only and does not constitute any offer, solicitation, recommendation, opinion or guarantee of any securities, virtual assets, financial products or instruments. Regulatory authorities may restrict the trading of virtual asset-related ETFs to only investors who meet specified requirements. Any calculations or images in the article are for illustrative purposes only.
Investment involves risks and the value and income from securities may rise or fall. Past performance is not indicative of future performance. Please carefully consider your personal risk tolerance, and consult independent professional advice if necessary.


