兩月暴漲近40%,珀萊雅配得上“國貨之光”嗎?
10月27日,珀萊雅發佈三季度業績,次日,公司股價於10點52分漲停封單,截至收盤股價210.65元,創下歷史新高。
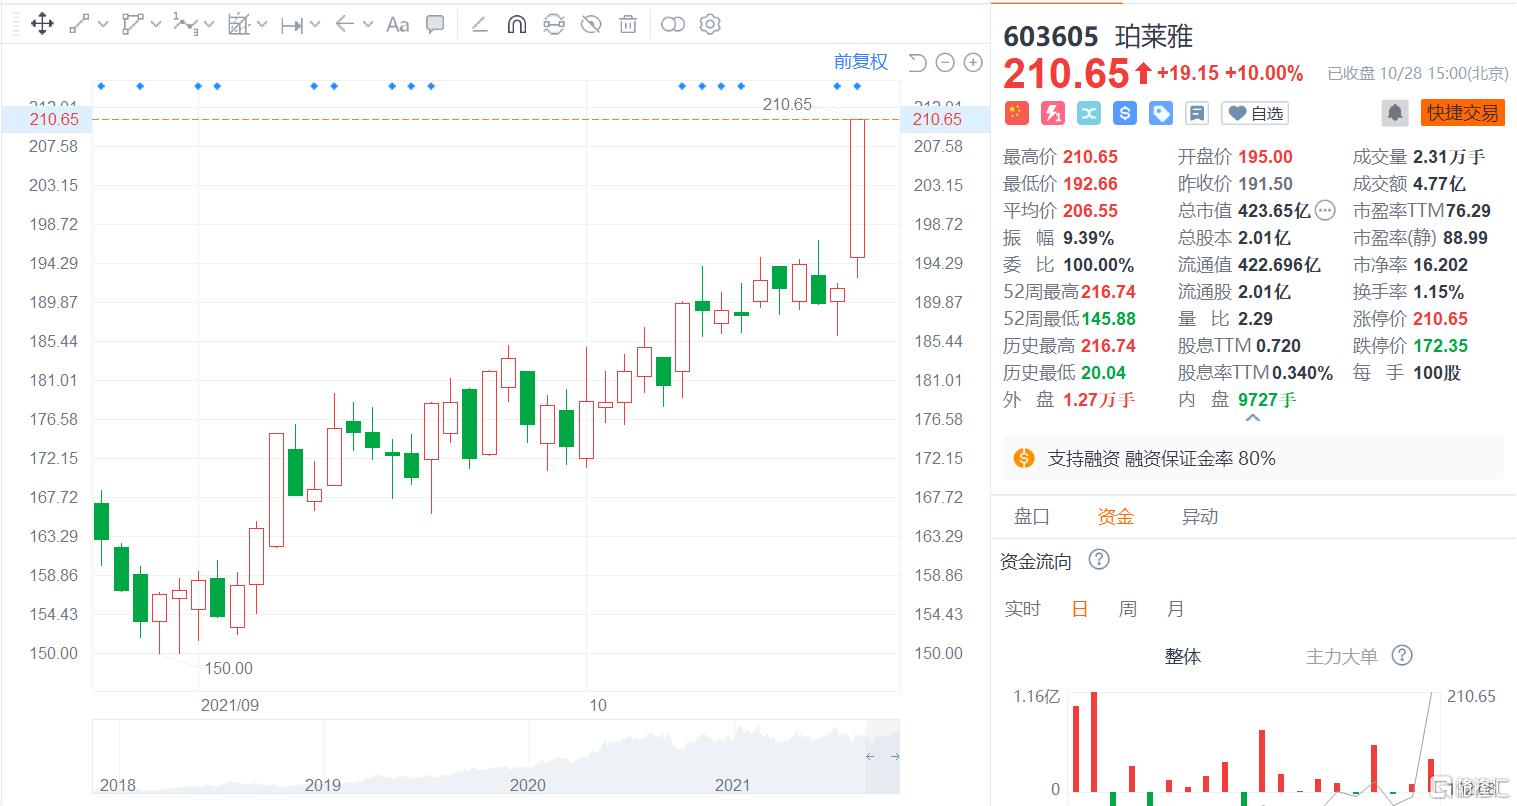
總體來看,珀萊雅2021年前三季度共實現營收30.12億元,同比增長31.48%,歸母淨利潤3.64億元,同比增長27.82%。單第三季度實現營收10.95億元,同比增長20.71%,歸母淨利潤1.38億元,同比增長30.09%,增速穩定。盈利能力方面,單三季度毛利率提升1.61%至66.10%,淨利率提升1.36%至12.65%。
珀萊雅這份高分答卷背後,是什麼在驅動呢?
01
線上渠道發力
財報顯示,珀萊雅第三季度營收及淨利潤獲得增長,主要得益於主營業務線上收入的大幅增長。
作為一個傳統化粧品牌,珀萊雅在2017年上市之前一直以線下營銷為主,採用經銷及代銷的模式,業績一度開始回落。2017年登陸上交所主板後,作為國內首家美粧上市公司,珀萊雅迎來了轉機。在電商行業崛起的進程中,公司着力線上業務,積極佈局各大新興渠道,線上收入佔比不斷擴大,截至今年三季度,公司線上收入佔比提升至81.85%,線下收入不斷收縮僅佔總營收不足兩成。
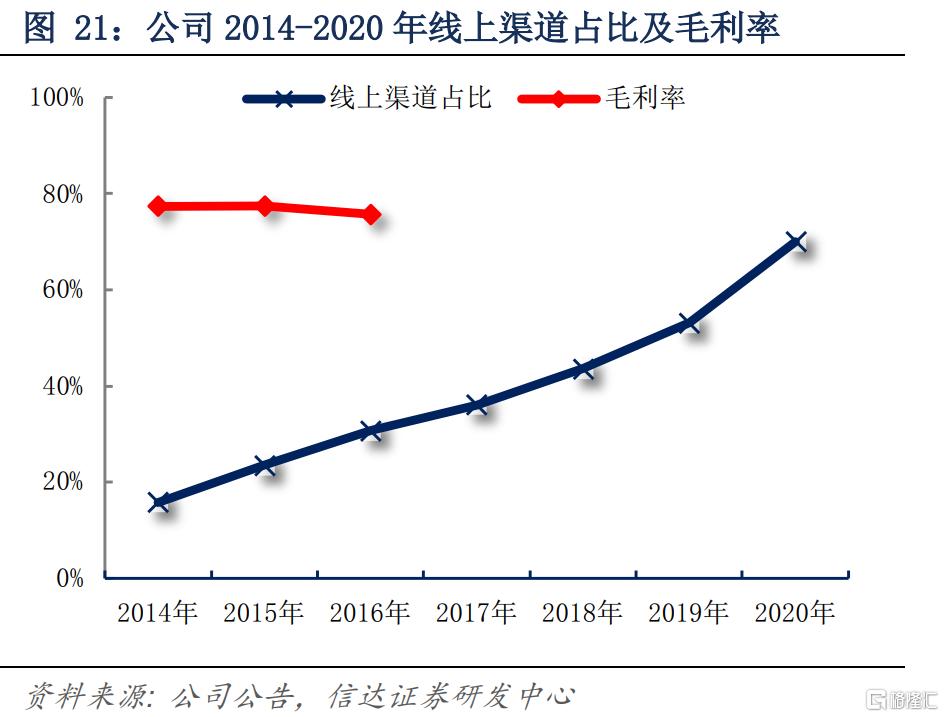
(2014-2020年珀萊雅線上收入佔比,來源:信達證券)
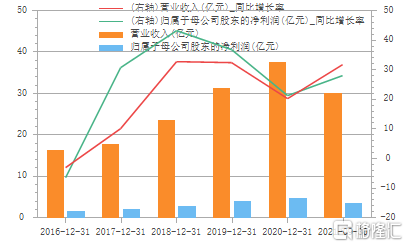
線下業務向線上轉移,使珀萊雅免於線下景氣度下行的限制,發展不斷提速,營業收入及歸母淨利潤均實現了大步增長,即便是在受疫情影響最為嚴重的2020年,公司營業收入及歸母淨利潤仍保持了20%以上的同比增速。
今年前三季度,珀萊雅線上渠道收入24.6億元,同增74.3%,直營渠道表現亮眼,收入大增約110%,單第三季度就同比增長超75%;分銷渠道上半年表現一般,前三季度僅保持了超20%的同比增長,但單三季度增速超60%。
在眾多線上渠道中,抖音小店表現較為突出,2021年中報數據顯示,2020年11月以來,珀萊雅始終保持抖音品牌小店美粧板塊的TOP3位置。今年上半年珀萊雅在抖音渠道已經實現營收2億元,據飛瓜數據顯示,2021年1-9月,珀萊雅抖音小店復購率14%,客單價144元,單今年第三季度,抖音小店商品交易總額高達3.75億元,超上半年總額,已然成為線上收入高速增長的主要驅動力。
02
大單品策略推動
除了線上發力外,珀萊雅的大單品策略也為公司業績增長做出了巨大貢獻。
2019年下旬,珀萊雅開始試水大單品策略,相較於彩粧,更強調效果的護膚品用户粘性更高,消費者對於有效或合適的護膚品會重複購買,所以珀萊雅以泡泡麪膜作為核心產品推廣,雖然在短暫的爆發後泡泡麪膜單品出現大幅下降,但它帶動了公司面膜品類銷量增長,可見泡泡麪膜已初步具有能夠帶動周邊系列產品銷量和口碑提升的能力,為公司積累了爆款產品打造的經驗。
2020年第一季度,珀萊雅以精華作為切入口,推出紅寶石精華及雙抗精華,打造高性價比精華爆品,併成功出圈。據點淘數據顯示,在10月20日(雙十一預售日)僅李佳琦直播間二者就售出超45萬套,銷量驚人。
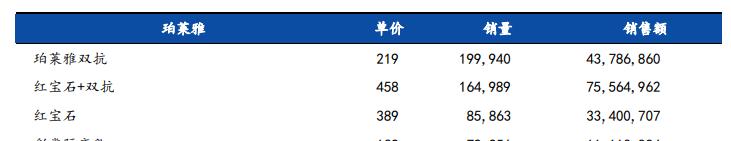
(10月20日李佳琦直播間珀萊雅產品銷量,來源:點淘)
今年前三季度,珀萊雅主品牌收入同比增長28%,其中大單品收入佔品牌總量超20%,佔天貓平台超50%,品牌客單價、復購率有顯著提升。
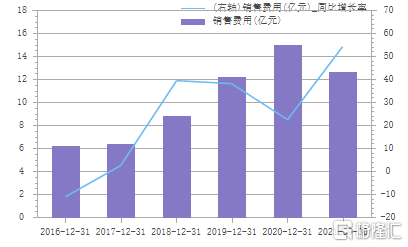
線上業務的拓寬和大單品的推廣雖然帶來了業績上的高速增長,但同時珀萊雅的銷售費用增速更快,公吿披露顯示,2018-2019年,珀萊雅銷售費用同比增長將近40%,2020年疫情期間雖有短期放緩,但今年前三季度銷售費用再度突破,增至12.62億元,增速高達54%,結合公司今年前三季度3.47億元的淨利潤及25.74%的淨利潤增速,可見,銷售費用對公司利潤的侵蝕不容小覷。
此外,珀萊雅定價模式帶來的矛盾也有可能對公司發展造成影響。據瞭解,珀萊雅除了對直銷、經銷和代銷三種銷售模式差異性定價外,還針對日常、中小型活動、大型活動等等進行了細分定價,但複雜的定價機制並沒有匹配嚴格的價格控制手段,導致珀萊雅產品在不同終端價格存在差異,且造成了供應商與珀萊雅之間的矛盾,目前珀萊雅旗下杭州珀萊雅貿易有限公司與日照金瑞德經貿有限公司、鄭州怡亞通翔隆供應鏈管理有限公司等供應商仍存在着合同糾紛。
Follow us
Find us on
Facebook,
Twitter ,
Instagram, and
YouTube or frequent updates on all things investing.Have a financial topic you would like to discuss? Head over to the
uSMART Community to share your thoughts and insights about the market! Click the picture below to download and explore uSMART app!

Disclaimers
uSmart Securities Limited (“uSmart”) is based on its internal research and public third party information in preparation of this article. Although uSmart uses its best endeavours to ensure the content of this article is accurate, uSmart does not guarantee the accuracy, timeliness or completeness of the information of this article and is not responsible for any views/opinions/comments in this article. Opinions, forecasts and estimations reflect uSmart’s assessment as of the date of this article and are subject to change. uSmart has no obligation to notify you or anyone of any such changes. You must make independent analysis and judgment on any matters involved in this article. uSmart and any directors, officers, employees or agents of uSmart will not be liable for any loss or damage suffered by any person in reliance on any representation or omission in the content of this article. The content of the article is for reference only and does not constitute any offer, solicitation, recommendation, opinion or guarantee of any securities, virtual assets, financial products or instruments. Regulatory authorities may restrict the trading of virtual asset-related ETFs to only investors who meet specified requirements. Any calculations or images in the article are for illustrative purposes only.
Investment involves risks and the value and income from securities may rise or fall. Past performance is not indicative of future performance. Please carefully consider your personal risk tolerance, and consult independent professional advice if necessary.


