芯導科技明日首發上會:研發、銷售均存隱憂
近日,上交所披露公吿顯示,上海芯導電子科技股份有限公司(簡稱“芯導科技”)將於8月25日科創板首發上會。
此次IPO,芯導科技擬募資4.44億元,用於產品的開發和升級,以及研發中心項目的建設,國元證券為其保薦機構。
芯導科技成立於2009年,是一家專注於高品質、高性能的模擬集成電路和功率器件開發及銷售的芯片公司,公司主營業務為功率半導體的研發與銷售。
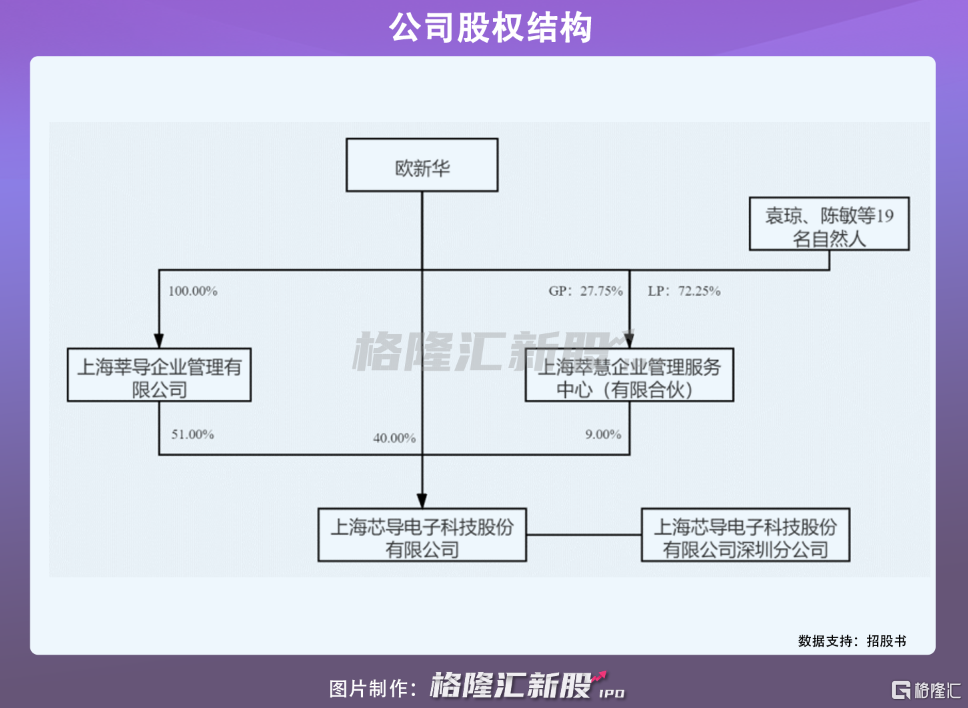
股權架構顯示,上海莘導企業管理有限公司持有芯導科技51%的股份,為公司的控股股東。歐新華直接持有公司40%的股份,為公司的實際控制人。
1
產品收入結構集中
隨着電子產品的迭代升級,半導體在電子產品中的含量逐漸增高。功率半導體是對功率進行變頻、變壓、變流、功率放大及管理的半導體器件,生活中凡涉及發電、輸電、變電、配電、用電、儲電等環節的均離不開功率半導體。
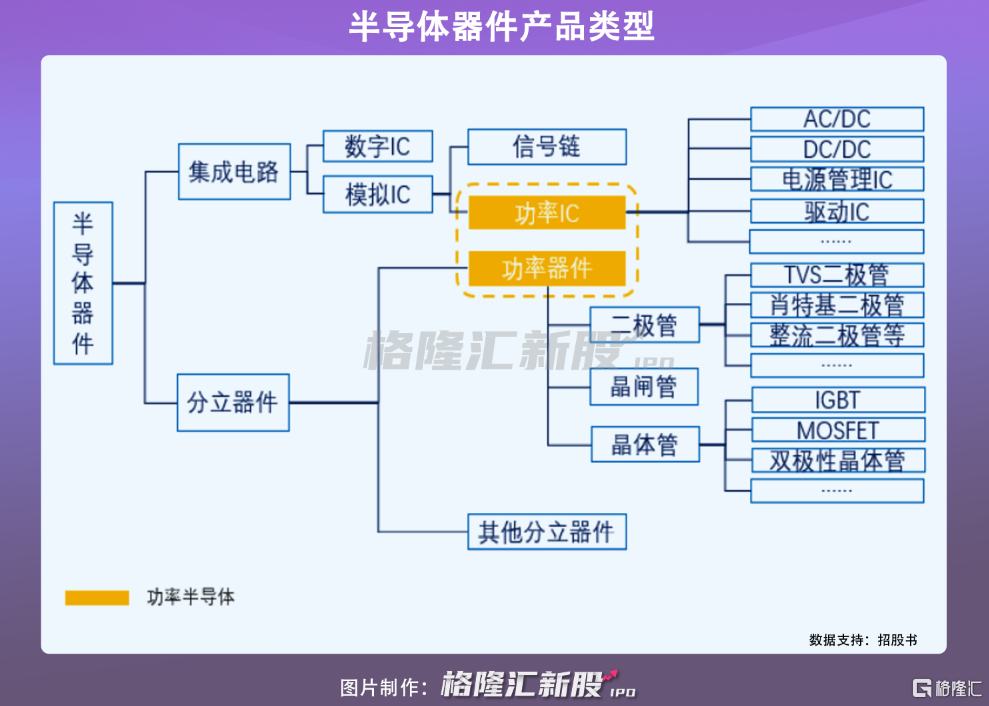
芯導科技功率半導體產品包括功率器件和功率IC兩大類,主要應用在消費類電子,其次是安防領域、網絡通訊領域、工業領域。公司的功率器件產品有TVS、MOSFET和肖特基,其中TVS、肖特基屬於二極管,MOSFET屬於晶體管;而功率IC產品主要為電源管理IC。
報吿期內,芯導科技實現營收2.9億元、2.8億元、3.7億元,歸屬公司股東的淨利潤為4967萬元、4809萬元、7416萬元。
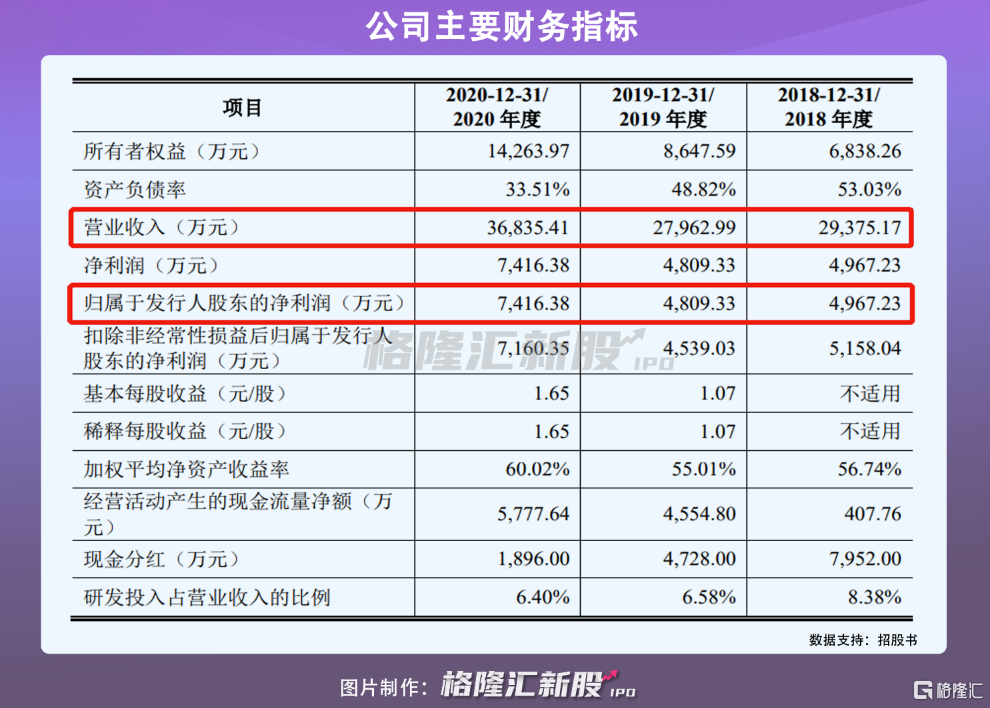
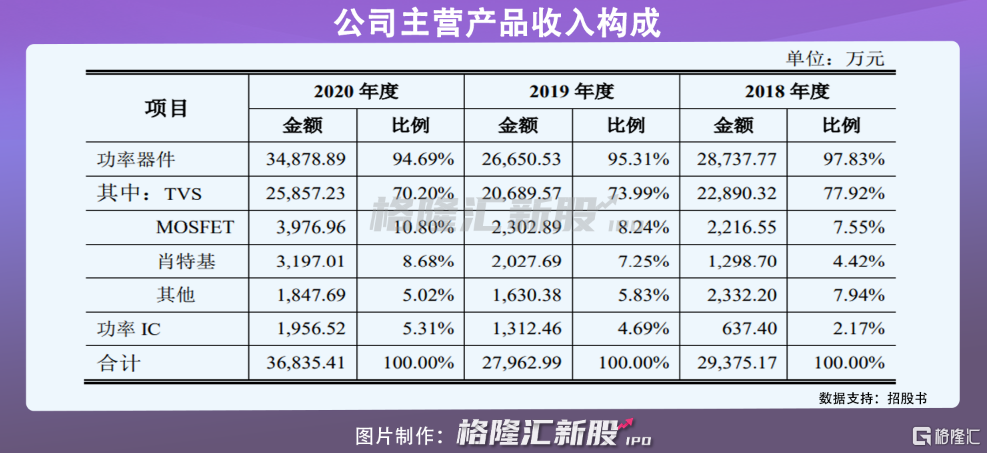
按業務細分來看,功率器件是公司的主要收入來源,連續三年佔比營收高達95%,其中功率器件以TVS為主,報吿期內佔比分別為77.91%、73.99%和70.2%。2019年,由於全球手機收貨量下降,TVS產品受此影響收入亦有所下降,致使功率器件整體規模也呈下降態勢;而2020年,TVS、MOSFET、肖特基收入大幅增加,帶動功率器件收入增長。
芯導科技的商業業績增長很大程度受益於功率半導體的需求驅動。近年來,隨着全球電子製造業持續升級發展,電力終端消費增加,全球功率半導體產業規模穩步增長。2019年,全球功率半導體市場規模約400億美元,預計2019年至2025年複合年增長率4.5%。
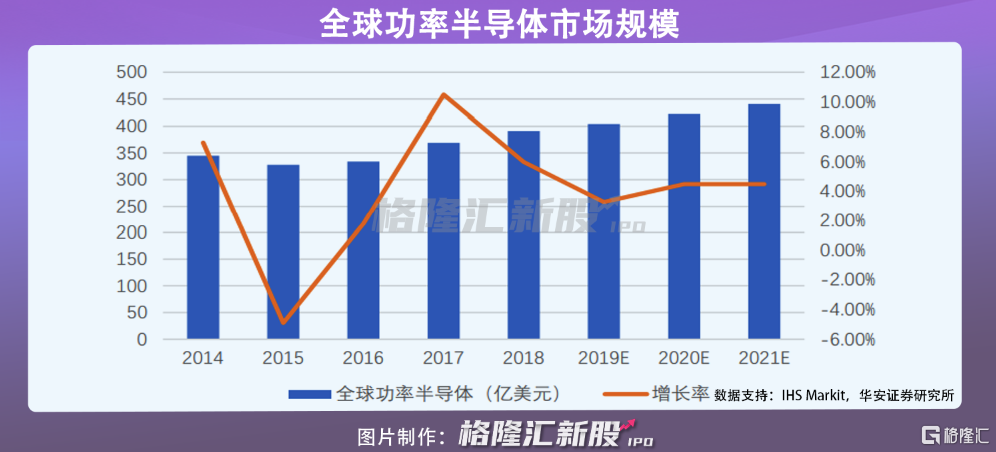
目前,功率半導體市場參與者主要以歐美企業為主,全球前五大廠商分別為安世半導體(Nexperia)、意法半導體(ST Microelectronics)、商升特(Semtech)、安森美(ON Semiconductor)、晶焱(Amazing),2020年銷售額為7.08億美元,佔全球市場份額約67.12%。
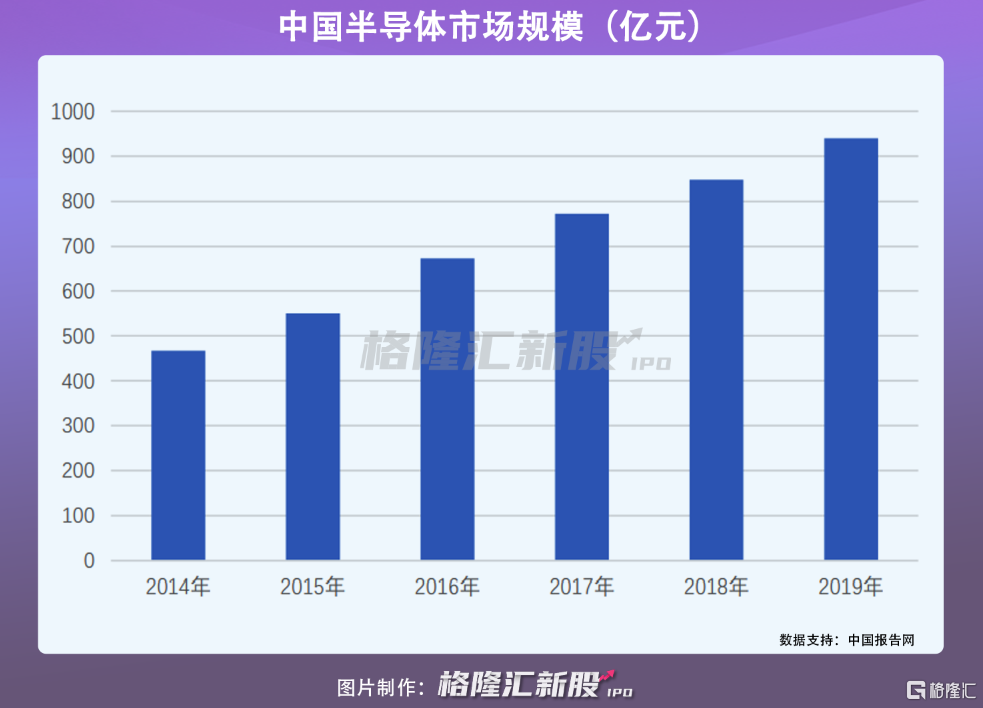
中國功率半導體行業發展起步較晚,與國際同行公司仍有較大差距,因而中高端產品一定程度上仍依賴進口。從市場規模來看,中國功率半導體產業自2014年起持續增長,2019年市場規模約為940.8億元,佔全球市場規模35%左右,是全球最大的功率半導體市場。不過2019年中國大陸功率半導體市場總體國產化率還不到50%,意味着國產替代化空間巨大,存有廣闊的發展前景。
2
研發費用率不及同行
功率半導體產品的性能要求基本沒有太多的變化,但依然在追求更高的功率、更小的體積、更低的損耗與更好的性價比。
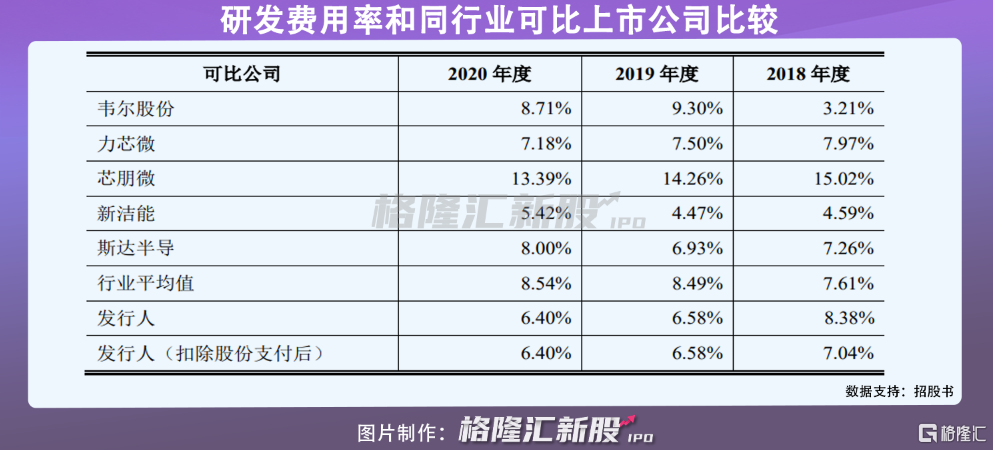
報吿期內,芯導科技研發費用率分別為 8.38%、6.58%和 6.40%,明顯低於行業平均值。功率半導體產業技術門檻較高,屬於技術密集型行業,在市場競爭激烈及芯導科技市場規模相對較小的情況下,應繼續加大研發力度,夯實自身技術實力以保障市場份額穩健增長。
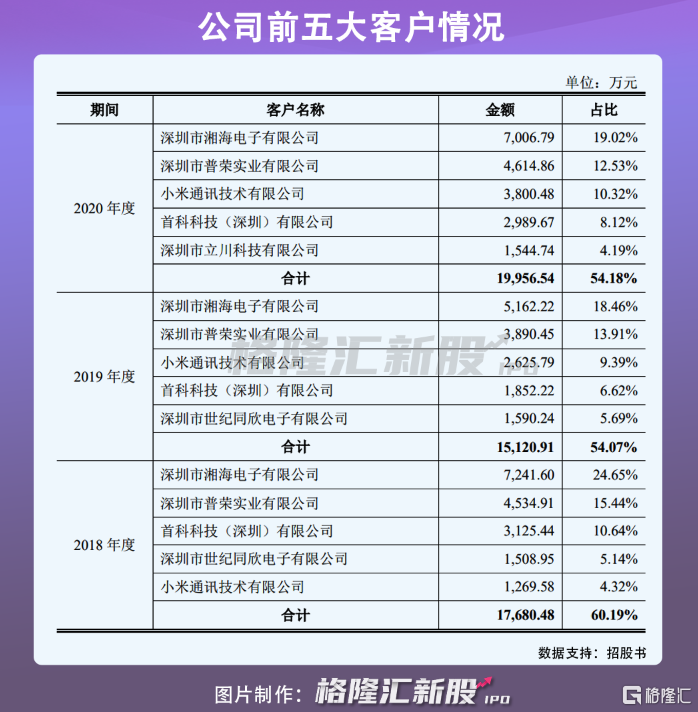
從芯導科技的客户情況來看,公司的TVS等產品已成功進入小米、TCL、傳音等手機品牌廠商,及華勤、聞泰、龍旗等手機ODM廠商,在市場有一定的認可度。但公司前五大客户湘海、普榮、小米、首科、立川報吿期內佔比營收60.19%、54.07%、54.18%,集中度相對較高。倘若公司未能准將把握市場趨勢,或主要客户經營狀況發生變化,都有可能對芯導科技的業績造成不利影響。
3
結語
半導體產業屬朝陽行業,其中功率半導體不可或缺,凡涉及帶電的產品均廣泛應用。目前,中國半導體企業與國際仍有一定差距,但隨着市場規模逐漸擴大、產業快速發展,國產替代化迎來了廣闊的成長空間。但芯導科技在同業可比公司中規模相對較小,研發和銷售均存在一定隱憂,還需加大研發,實現產品多元化以及拓展客户羣體,來提升公司的競爭力。
Follow us
Find us on
Facebook,
Twitter ,
Instagram, and
YouTube or frequent updates on all things investing.Have a financial topic you would like to discuss? Head over to the
uSMART Community to share your thoughts and insights about the market! Click the picture below to download and explore uSMART app!

Disclaimers
uSmart Securities Limited (“uSmart”) is based on its internal research and public third party information in preparation of this article. Although uSmart uses its best endeavours to ensure the content of this article is accurate, uSmart does not guarantee the accuracy, timeliness or completeness of the information of this article and is not responsible for any views/opinions/comments in this article. Opinions, forecasts and estimations reflect uSmart’s assessment as of the date of this article and are subject to change. uSmart has no obligation to notify you or anyone of any such changes. You must make independent analysis and judgment on any matters involved in this article. uSmart and any directors, officers, employees or agents of uSmart will not be liable for any loss or damage suffered by any person in reliance on any representation or omission in the content of this article. The content of the article is for reference only and does not constitute any offer, solicitation, recommendation, opinion or guarantee of any securities, virtual assets, financial products or instruments. Regulatory authorities may restrict the trading of virtual asset-related ETFs to only investors who meet specified requirements. Any calculations or images in the article are for illustrative purposes only.
Investment involves risks and the value and income from securities may rise or fall. Past performance is not indicative of future performance. Please carefully consider your personal risk tolerance, and consult independent professional advice if necessary.


