中信建投:製造業投資並未走弱,年內仍有回升空間
本文來自格隆匯專欄:中信建投宏觀固收黃文濤,作者:黃文濤 王澤選
摘要
2021年8月16日,國家統計局發佈2021年7月國民經濟運行情況系列數據。7月製造業固定資產投資累計複合增速分別為3.1%(前值2.0%)。
正文
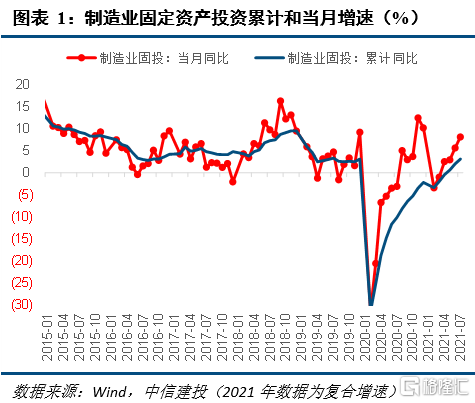
一、製造業投資單月增速並未走弱,市場計算方法存在誤讀
由於製造業固定資產投資金額僅公佈至2017年,此後僅公佈累計同比增速,因此在估算2017年以後的製造業固定資產投資當月同比增速時,目前流行的方法是根據2017年的投資金額及其後各月的累計同比增速,推算出各月的累計投資金額,再相鄰作差得到各月的當月投資金額,再計算出當月同比。
上述方法誤差較大,且距離2017年越遠誤差越大。由於固定資產投資統計的是計劃總投資 500萬元以上的固定資產項目,納入統計的企業每年發生變化,因此每年計算同比增速時需經過調整按可比口徑計算,不能直接和上年公佈的金額直接做同比。所以採用2017年的投資金額和統計局公佈的2018年以來的同比增速,推算出的2018年以來的投資金額是不準確的,一直推算至2021年的投資金額則誤差會更大。例如,6月、7月製造業固定資產投資累計複合增速分別為2.0%、3.1%,市場多數研究報吿根據上述方法推算出6月、7月的當月複合增速分別為6.0%、2.8%,且得出7月製造業投資當月增速下滑的結論。實際上,已知1-6月累計複合增速為2.0%,加上7月的數據後將1-7月累計複合增速拉到3.1%,那7月的當月複合增速一定需高於3.1%才符合數學基本法則,可見上述方法推算出的2.8%誤差極大。
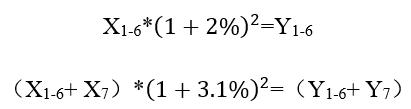
採用相對更為準確的測算方法,7月製造業投資當月增速繼續上行。設2019年1-6月製造業投資金額為X1-6,7月當月金額為X7,2021年1-6月製造業投資金額為Y1-6,7月當月金額為Y7,則有:
7月當月複合增速通過以下公式計算得到為8.1%,高於6月當月複合增速5.6%。
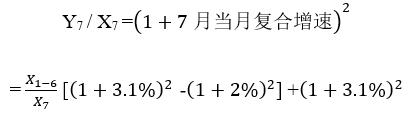
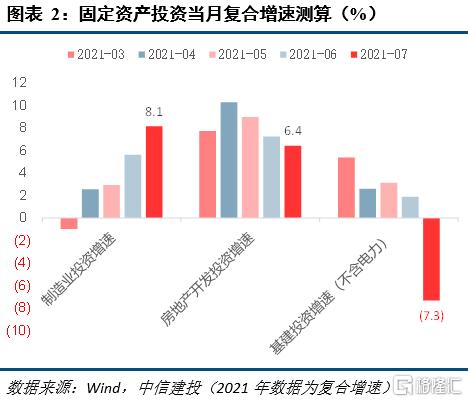
該方法的關鍵是用到了統計局公佈的兩年複合增速,比用2020年和2020年分別公佈的同比數據更為準確,此外需要用到2019年1-6月的投資金額和7月當月的推算的投資金額做比值,這個比值的誤差較小,其他月份的當月複合增速同理計算可得。通過該方法,也可測算不再公佈投資金額的基建投資各月的當月複合增速。總體看,今年以來固定資產投資呈現的是“兩降一升”的格局,僅製造業投資持續回暖,當月增速並未走弱,是經濟運行中不可忽視的積極因素。
二、年內支撐製造業投資積極因素仍在,增速仍有回升空間
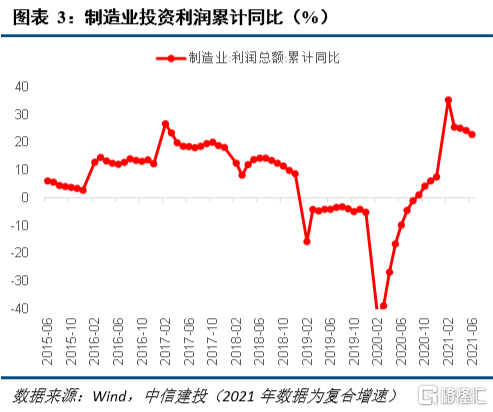
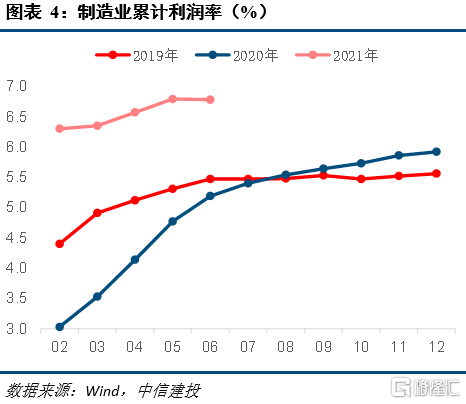
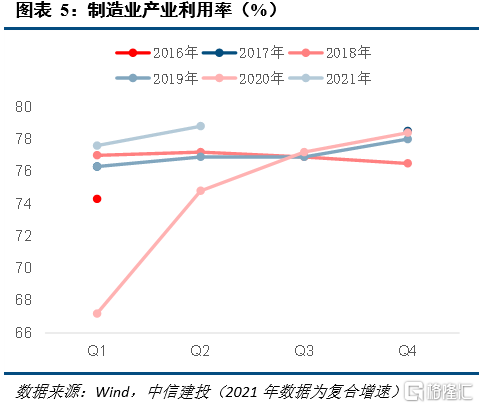
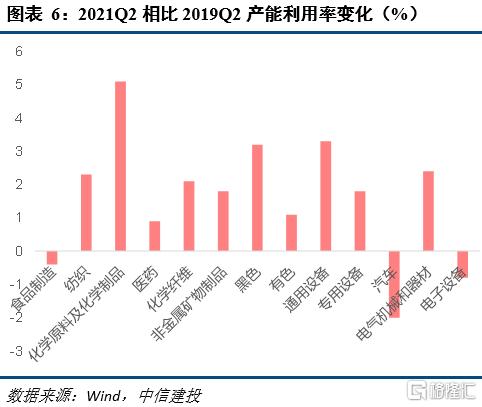
製造業投資的關鍵影響因素是企業利潤、產能利用率,當前處於歷史高位。高利潤、高產能利用率時期,企業對未來市場的預期會變得樂觀,自身既有投資擴產的意願,也有投資擴產的能力。2020年四季度以來,製造業企業利潤總額、利潤率明顯改善,2021年上半年製造業企業利潤同比增長67.3%,複合增速達到22.8%,處於近十年來最好水平。利潤率達到6.8%,明顯高於2019和2020年水平。產能利用率持續走高,二季度達到78.8%,也是2016年有統計以來的最高水平。
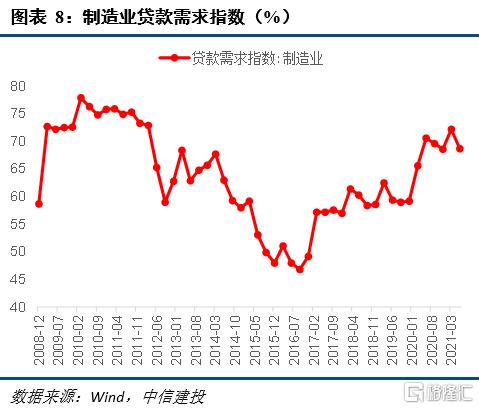
政策明顯向製造業傾斜,成為新的支撐因素。劉鶴在《加快構建以國內大循環為主體、國內國際雙循環相互促進的新發展格局》中提出,推動企業設備更新和技術改造。“十四五”規劃提出,深入實施製造強國戰略,推進產業基礎高級化、產業鏈現代化,保持製造業比重基本穩定。430政治局會議提出促進製造業投資和民間投資儘快恢復。730政治局會議提出引導企業加大技術改造投資。央行持續引導金融機構加大製造業中長期貸款投放力度,助力製造業高質量發展,截至2021年6月末,製造業中長期貸款餘額同比增長41.6%,增速連續4個月超過40%,製造業貸款需求指數升至高位。
綜上,從企業利潤、產能利用率、產業政策、金融政策角度看,我們認為年內製造業投資增速仍有回升空間,成為固定資產投資領域中的亮點。
風險提示:疫情反彈,外部環境不確定性加大。
Follow us
Find us on
Facebook,
Twitter ,
Instagram, and
YouTube or frequent updates on all things investing.Have a financial topic you would like to discuss? Head over to the
uSMART Community to share your thoughts and insights about the market! Click the picture below to download and explore uSMART app!

Disclaimers
uSmart Securities Limited (“uSmart”) is based on its internal research and public third party information in preparation of this article. Although uSmart uses its best endeavours to ensure the content of this article is accurate, uSmart does not guarantee the accuracy, timeliness or completeness of the information of this article and is not responsible for any views/opinions/comments in this article. Opinions, forecasts and estimations reflect uSmart’s assessment as of the date of this article and are subject to change. uSmart has no obligation to notify you or anyone of any such changes. You must make independent analysis and judgment on any matters involved in this article. uSmart and any directors, officers, employees or agents of uSmart will not be liable for any loss or damage suffered by any person in reliance on any representation or omission in the content of this article. The content of the article is for reference only and does not constitute any offer, solicitation, recommendation, opinion or guarantee of any securities, virtual assets, financial products or instruments. Regulatory authorities may restrict the trading of virtual asset-related ETFs to only investors who meet specified requirements. Any calculations or images in the article are for illustrative purposes only.
Investment involves risks and the value and income from securities may rise or fall. Past performance is not indicative of future performance. Please carefully consider your personal risk tolerance, and consult independent professional advice if necessary.


