鋼鐵行情捲土重來,千億龍頭10天暴漲40%!
今日,鋼鐵股延續多日強勢行情。
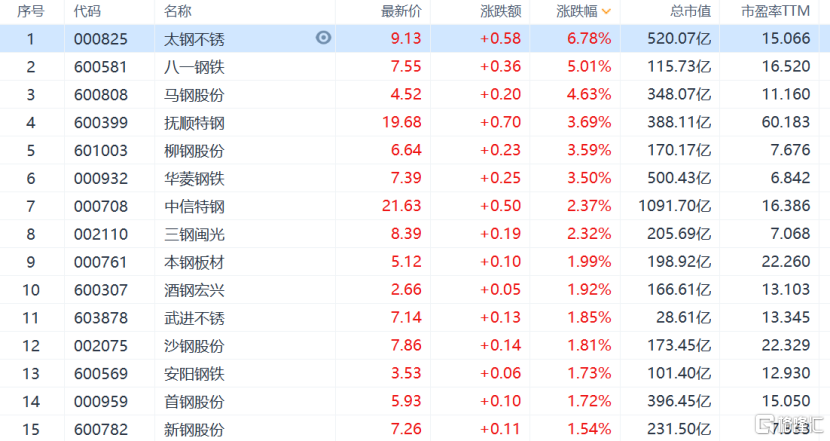
A股方面,鋼鐵板塊開盤領漲大市,馬鋼股份、太鋼不鏽一度漲超8%。截至收盤,太鋼不鏽漲6.78%,八一鋼鐵漲5%,撫順特鋼、華凌鋼鐵等漲超3%。
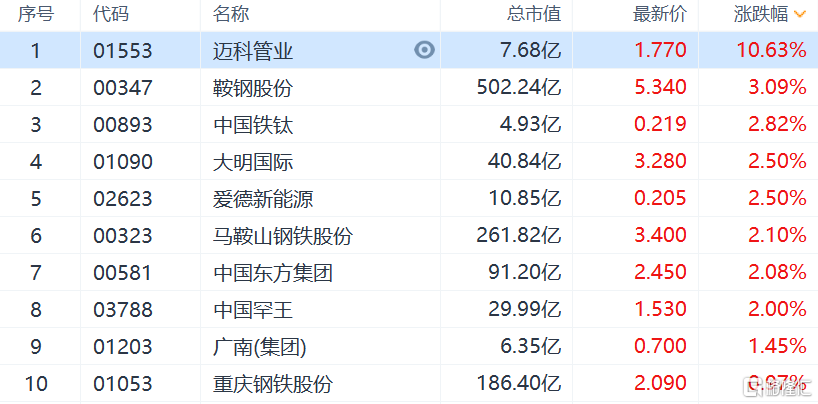
港股方面,鋼鐵股亦十分亮眼。馬鞍山鋼鐵股份一度漲超5%,重慶鋼鐵股份漲4%,午後有所回落。截止收盤,邁科管業漲超10%,鞍鋼股份漲超3%,馬鞍山鋼鐵漲超2%。
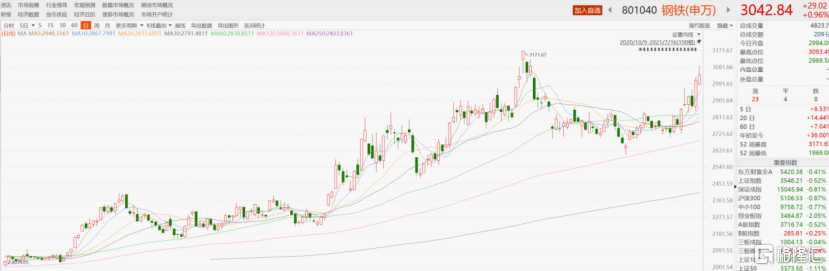
今年上半年,鋼鐵板塊經歷了歷史罕見的瘋狂行情,鋼鐵指數(申萬)年初至5月10日的歷史高位漲幅近40%。而後,由於國常會等監管層的出手,行情降温明顯,一度回落16%。
不過自6月中旬以來,鋼鐵股再度啟動暴漲行情,近一個月鋼鐵指數(申萬)漲超13%,如今已逼近此前歷史高位。
而鋼鐵股近期的強勁走勢,是由多種因素共同作用而致。
首先是鋼鐵企業二季度業績普遍超預期直接導致了鋼鐵股的強勁走勢。截止7月15日,共有24家上市公司發佈了上半年業績預吿,多個鋼鐵公司淨利潤創2016年以來新,17家公司同比增長翻倍,其中最大增幅為包鋼股份,預計半年度歸母淨利潤同比暴增2281%~3233%,近10個交易日大漲超40%,市值已近千億。
其次,近期多省份陸續發佈的鋼鐵下半年限產政策進一步助推了鋼鐵股的暴漲。今年以來,鋼鐵中心唐山地區持續嚴格執行環保限產,近期寶武系鋼廠以及安徽、江蘇、甘肅等地區也都進行了相關會議下放指標,要求產量不能高於 2020年,也呼應了年初工信部部長肖亞慶表示的“確保粗鋼產量下降”。
數據顯示,今年1-5月份,中國累計生產粗鋼47310萬噸,同比增長13.9%。據此預測,今年上半年的粗鋼產量將達到5.6億噸,全年粗鋼產量預計會超過11.2億噸。而2020年粗鋼產量數據為10.65億噸,上半年粗鋼產量是4.99億噸,下半年粗鋼產量為5.66億噸。因此為確保粗鋼產量不增加,預計減產量空前,從開工率來看,短期力度不明顯,下半年壓力巨大。
一面是產量下降,另一面則是原材料價格觸頂回落和鋼價觸底反彈。
由於市場對全國範圍內推進鋼鐵產量壓減工作已形成較強預期,加上全國碳交易市場的開放等,推動了鋼材價格淡季上行。東吳證券分析,今年7月以來,鋼鐵行業呈現鋼材價格上漲而鐵礦、焦炭等原材料下跌的局面,目前部分品種利潤已超過1000元/噸以上,回到二季度的平均水平。從當前形勢看,鋼廠利潤大概率繼續擴大,下半年不排除超過二季度高點的可能。
此外,剛剛落地的降準,進一步加強了金融對實體經濟特別是中小微企業的支持,促進綜合融資成本穩中有降,市場分析這對鋼價也有所提振。
從需求端來看,鋼鐵出口較5月有明顯上升,且海外需求仍然旺盛;國內需求方面,進入7月中下旬,長江中下游地域將陸續出梅,終端需求或有望有所增強,同時第三季度即將迎來鋼鐵行業金九銀十需求旺季,不排除部分區域會出現基建趕工,對行業也是利好支撐。
總之,面對需求端的增強和供給端減產的巨大壓力,預計下半年國內鋼鐵供需的不平衡將進一步加劇,鋼材價格大概率將繼續上揚。
行業方面,鋼鐵企業今年以來兼併重組持續加速。5月13日,河南第一大鋼鐵公司安陽鋼鐵與國內最大民營鋼企沙鋼集團宣佈混改;2021年7月14日,寶武集團與山東省國資委籌劃對山鋼集團戰略重組事項,這也是繼2019年以來中國寶武接連重組馬鋼集團、太鋼集團和重慶鋼鐵等多家大型鋼鐵企業,並先後託管了中鋼和昆鋼後鋼鐵巨無霸的再度出手。
另外,韶鋼松山與粵北鋼鐵、鄂城鋼鐵與十堰榕峯鋼鐵等中小鋼企也在持續參與整合。在此情況下,預計下半年鋼鐵企業集中度將進一步上行,推動行業盈利水平的進一步增強。
來源:東興證券
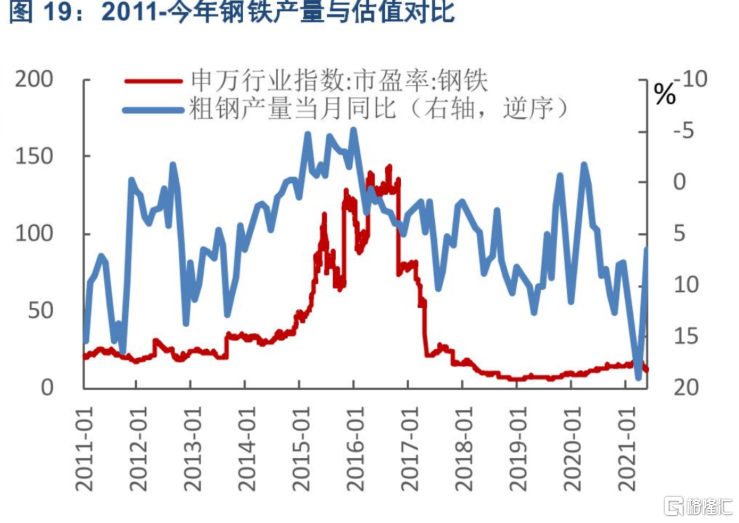
最後,從板塊估值上看,相比新能源、光伏等熱門板塊,鋼鐵的估值仍處於相對歷史低位,同時板塊未來業績確定性強,因此長期來看,鋼鐵股行情仍值得期待,不過也要警惕國家政策對板塊的影響,以及短期內進口鐵礦石等原材料暴漲的風險。
Follow us
Find us on
Facebook,
Twitter ,
Instagram, and
YouTube or frequent updates on all things investing.Have a financial topic you would like to discuss? Head over to the
uSMART Community to share your thoughts and insights about the market! Click the picture below to download and explore uSMART app!

Disclaimers
uSmart Securities Limited (“uSmart”) is based on its internal research and public third party information in preparation of this article. Although uSmart uses its best endeavours to ensure the content of this article is accurate, uSmart does not guarantee the accuracy, timeliness or completeness of the information of this article and is not responsible for any views/opinions/comments in this article. Opinions, forecasts and estimations reflect uSmart’s assessment as of the date of this article and are subject to change. uSmart has no obligation to notify you or anyone of any such changes. You must make independent analysis and judgment on any matters involved in this article. uSmart and any directors, officers, employees or agents of uSmart will not be liable for any loss or damage suffered by any person in reliance on any representation or omission in the content of this article. The content of the article is for reference only and does not constitute any offer, solicitation, recommendation, opinion or guarantee of any securities, virtual assets, financial products or instruments. Regulatory authorities may restrict the trading of virtual asset-related ETFs to only investors who meet specified requirements. Any calculations or images in the article are for illustrative purposes only.
Investment involves risks and the value and income from securities may rise or fall. Past performance is not indicative of future performance. Please carefully consider your personal risk tolerance, and consult independent professional advice if necessary.


