銷量大增,半年業績卻大幅下滑!長安汽車怎麼了?
本文來自:國際金融報,作者:肖逸思
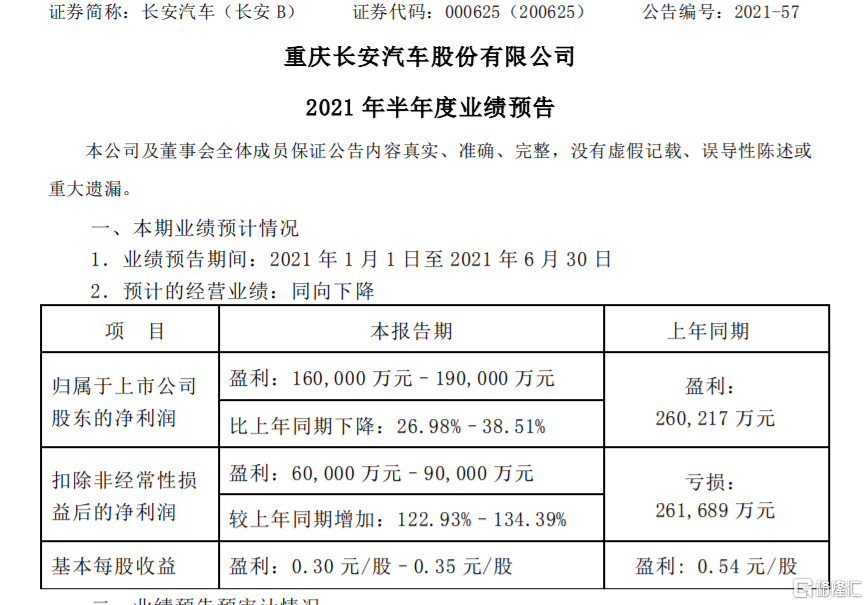
7月14日晚間,長安汽車發佈今年上半年度業績預吿。預吿顯示,今年上半年,長安汽車歸母淨利潤預計盈利16億-19億元,與去年同期的26.02億元相比下降了26.98%-38.51%。
長安汽車曾在過去三個月內股價實現翻番,儼然成為了熱門汽車整車股。此業績預吿一出,便受到了不少熱議。雖然在業績預吿內,長安汽車對上半年度業績下滑做出瞭解釋,稱主要因非經常性損益與去年同期相比大幅減少約42億元,但依舊沒有抵擋住股價的下滑。
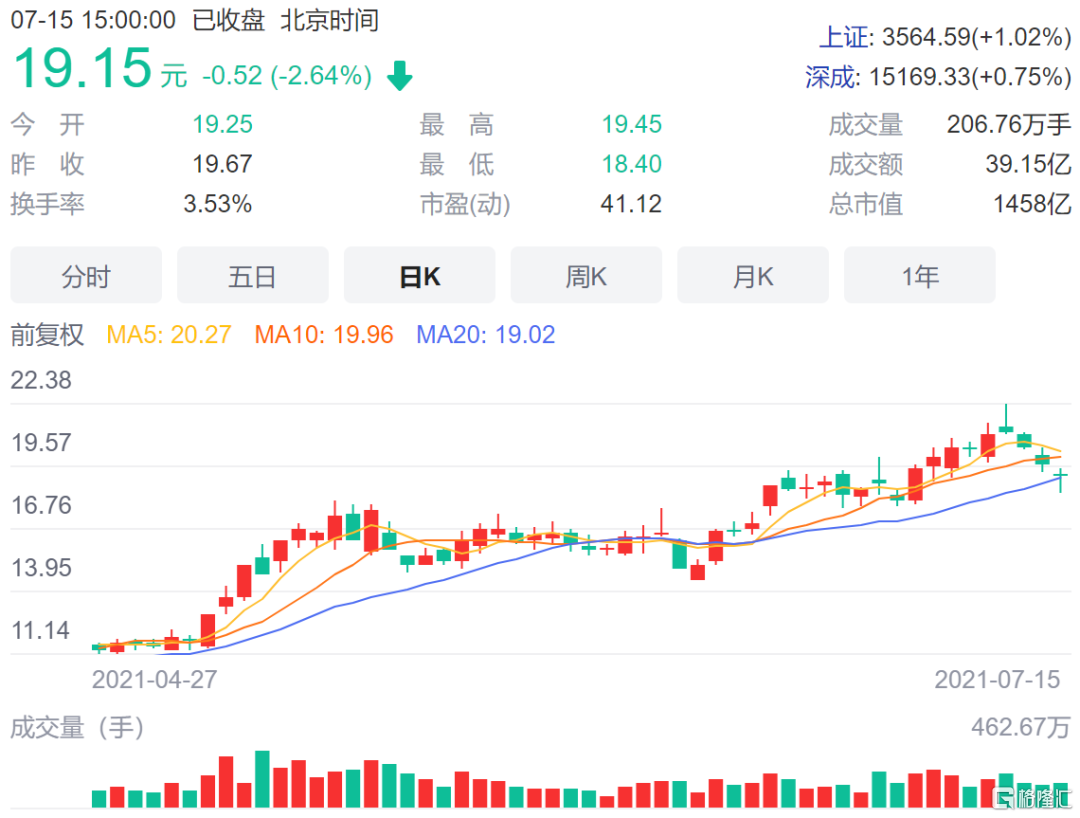
7月15日,長安汽車盤中一度跌超6%,截至收盤,其股價跌2.64%至19.15元,總市值為1458億元。而就在三個交易日前,長安汽車最高價還創下了歷史新高,達22.38元。
業績下滑情有可原?
事實上,今年上半年,長安汽車歸母淨利潤大幅下滑的原因正如其業績預吿所述,長安汽車非經常性損益相比去年而言出現了高額下滑,這直接影響了其歸母淨利潤。
記者獲悉,去年上半年,長安汽車頻繁出售子公司股權獲得了不少收益,在報吿期內長安汽車主要的非經常性損益項目包括:
全資子公司重慶長安新能源汽車科技有限公司引入戰略投資者,公司放棄增資優先認購權,增加歸屬於上市公司股東的淨利潤約21億元;
出售長安標緻雪鐵龍汽車有限公司股權增加歸屬於上市公司股東的淨利潤約14億元;
公司持有的寧德時代股票股價上漲增加歸屬於上市公司股東的淨利潤約17.75億元。
上述三項非經常性損益對長安汽車去年上半年的淨利潤貢獻就高達66.75億元,如果扣除這些非經常性損益的去年上半年長安汽車歸母淨利潤其實是虧損的,虧損金額超26億元。而今年上半年,長安汽車扣除非經常損益後的淨利潤預計為6億-9億元,較去年同期增長了122.93%–134.39%。
長安汽車在公吿中表示,扣除非經常性損益後的淨利潤同比大幅增加,主要因公司銷量增長、產品結構優化,自主業務盈利能力持續提升,合資業務盈利能力穩步改善。
二季度銷售“拖後腿”
根據官方公開數據,長安汽車今年上半年銷量實現了較大幅度的增長,長安汽車1-6月累計銷量超120萬輛,實現了44.5%的同比增長。在自主板塊方面,長安汽車1-6月累計銷量達到96.56萬輛,半年銷量逼近百萬輛大關,同比增長高達53.5%。
另據中國乘聯會最新數據,今年1-6月,長安汽車的銷量為61.3萬輛,同比增加64.2%,市場份額為6.2%,排在一汽大眾、上汽大眾、上汽通用後,位列榜單第4位,排在國內自主車企的第1位。
但這依舊弱於長安汽車今年一季度的成績。乘聯會數據顯示,第一季度,長安汽車的銷量為34.8萬輛,同比增加高達124.9%,份額為6.8%,排在榜單第3位,位於一汽大眾和上汽大眾之後。
照此計算,長安汽車在二季度的銷量約為26.5萬輛,比今年一季度環比減少了8.3萬輛,並由此導致了其同比增幅和市場份額雙雙下滑。
不僅如此,在淨利潤方面,雖然上半年同比下滑情有可原,但長安汽車二季度依舊呈現出了“拖後腿”的情況。
今年一季度財報顯示,長安汽車歸母淨利潤為8.54億元,扣除非經常性損益後的淨利潤為7.2億元。
照此計算,今年二季度,長安汽車歸母淨利潤預計為7.46億-10.46億元,該區間的平均值8.96億元雖與一季度相差不大,但在扣除非經常性損益後的淨利潤方面,長安汽車二季度預計為-1.2億元至1.8億元,這意味着在正常經營方面,長安汽車二季度幾乎不賺錢,甚至還在虧錢,與一季度的7.2億元也相去甚遠。
Follow us
Find us on
Facebook,
Twitter ,
Instagram, and
YouTube or frequent updates on all things investing.Have a financial topic you would like to discuss? Head over to the
uSMART Community to share your thoughts and insights about the market! Click the picture below to download and explore uSMART app!

Disclaimers
uSmart Securities Limited (“uSmart”) is based on its internal research and public third party information in preparation of this article. Although uSmart uses its best endeavours to ensure the content of this article is accurate, uSmart does not guarantee the accuracy, timeliness or completeness of the information of this article and is not responsible for any views/opinions/comments in this article. Opinions, forecasts and estimations reflect uSmart’s assessment as of the date of this article and are subject to change. uSmart has no obligation to notify you or anyone of any such changes. You must make independent analysis and judgment on any matters involved in this article. uSmart and any directors, officers, employees or agents of uSmart will not be liable for any loss or damage suffered by any person in reliance on any representation or omission in the content of this article. The content of the article is for reference only and does not constitute any offer, solicitation, recommendation, opinion or guarantee of any securities, virtual assets, financial products or instruments. Regulatory authorities may restrict the trading of virtual asset-related ETFs to only investors who meet specified requirements. Any calculations or images in the article are for illustrative purposes only.
Investment involves risks and the value and income from securities may rise or fall. Past performance is not indicative of future performance. Please carefully consider your personal risk tolerance, and consult independent professional advice if necessary.


