中證500跑贏滬深300背後的邏輯
本文來自:國盛策略,作者: 林志朋、樑思涵
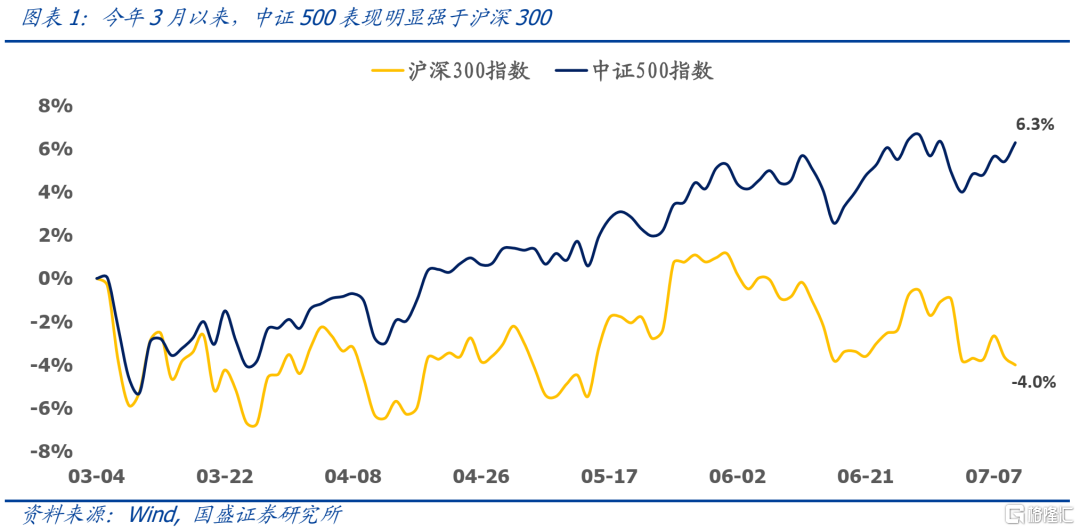
本文將基於GK模型再次論述未來一年內,中證500大概率仍將跑贏滬深300。自從我們在3月4日外發報告《爲什麼我們相對看好中證500——基於GK模型的收益預測》後,中證500指數累計上漲6.3%,而滬深300指數累計下跌4%,至今中證500已經創下了10.3%的超額收益。當前時點,有一部分投資者更加堅定了對中證500的信心,但也有部分投資者擔心中證500已經基本兌現未來收益。
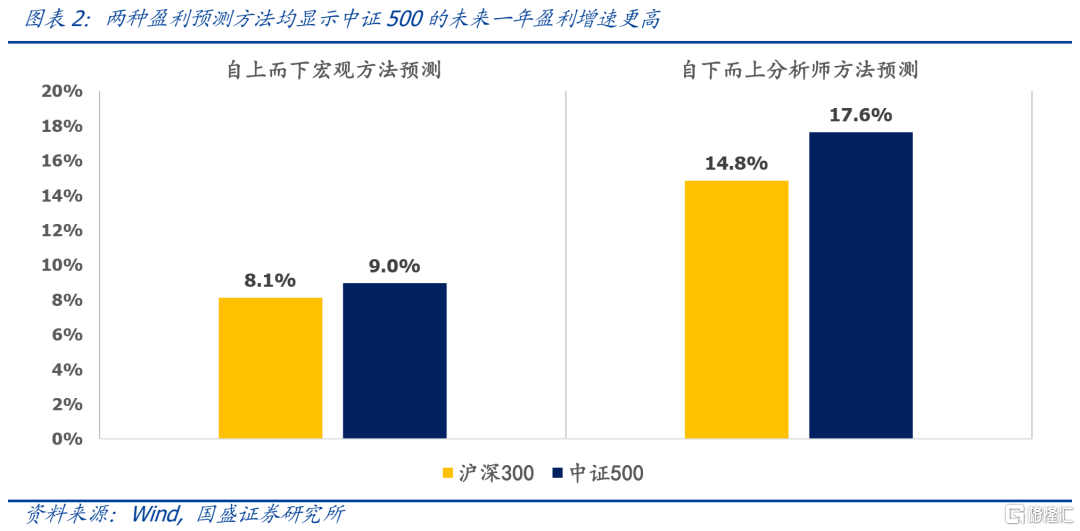
盈利方面中證500仍佔優勢。當前宏觀模型預測300和500的預期盈利增速爲8.1%和9.0%,分析師模型預測300和500的預期盈利增速爲14.8%和17.6%,兩種盈利預測方法均顯示A股未來盈利有較強的韌性,且中證500的盈利優勢更大。
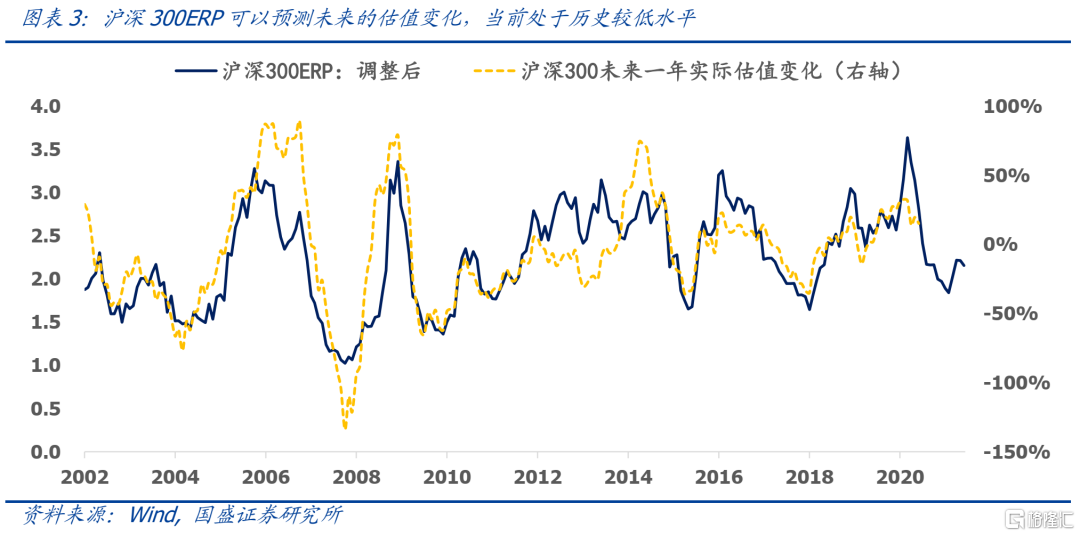
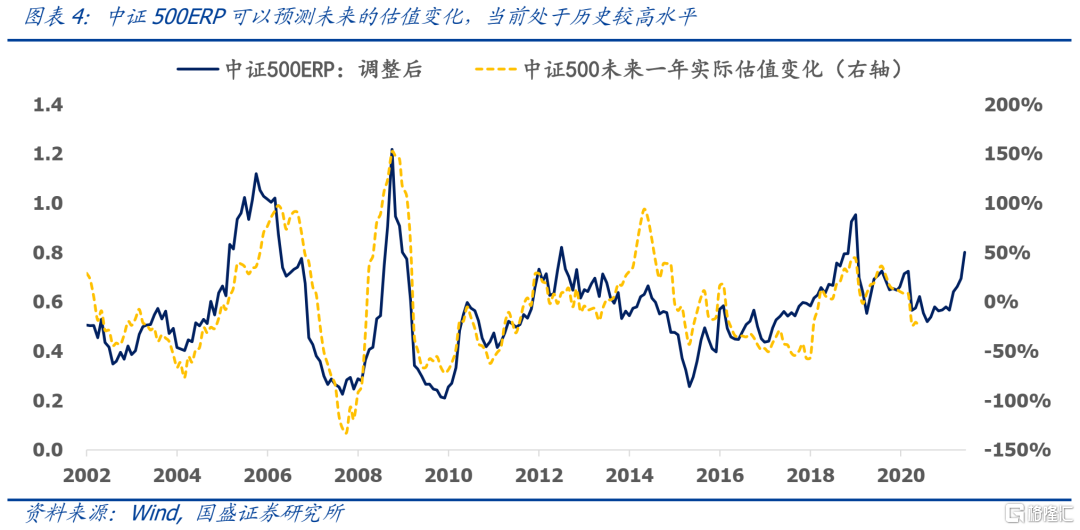
估值層面中證500有巨大的優勢。當前時點,滬深300的ERP處於歷史低位,而中證500的ERP卻處於歷史高位,根據A股估值預測系統,滬深300未來一年估值將回落3.8%,而中證500指數未來一年估值將上行13.5%。
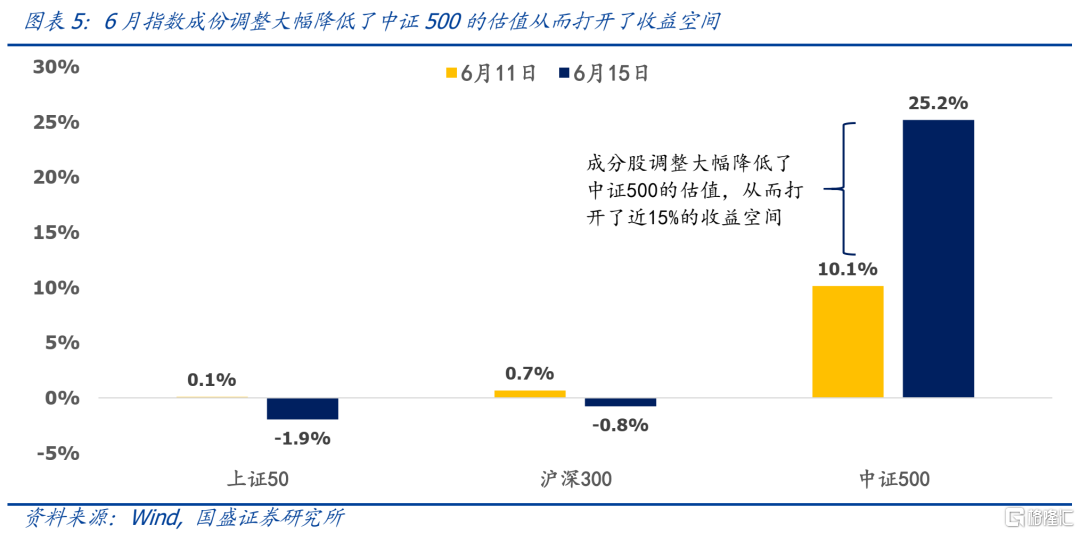
今年6月的指數成分調整打開了中證500的收益空間。指數成分調整也必然影響指數的預期收益。此次調整大幅降低了中證500的估值,從而讓中證500指數提升了近15%的預期收益。
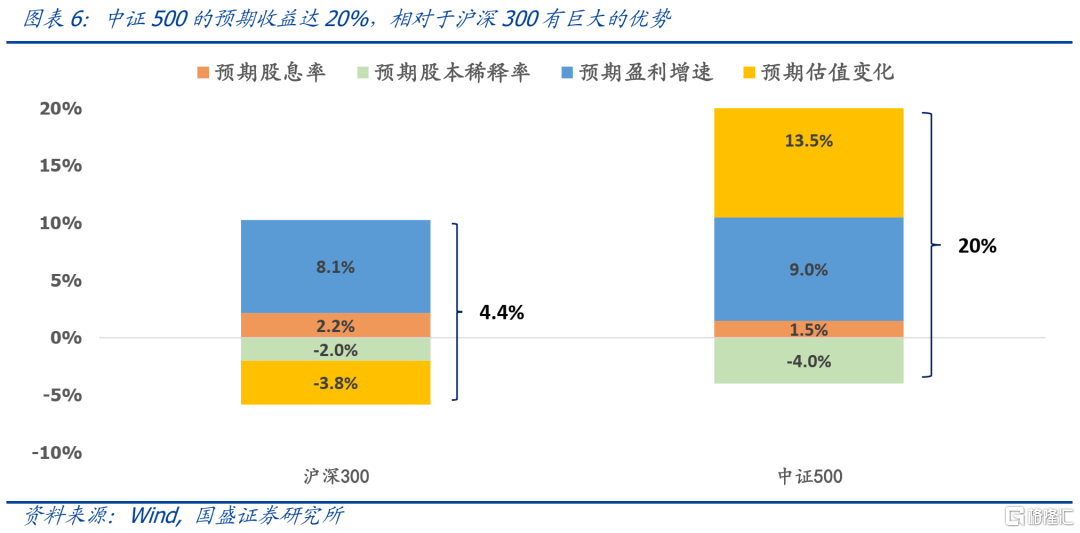
綜合來看,當前中證500的預期收益達20%。當前中證500相對於滬深300無論在盈利維度還是在估值維度均具有優勢,中證500預期收益高達20%,而滬深300預期收益僅爲4.4%。因此我們認爲超配中證500ETF或者中證500指數增強產品仍是未來的主要配置方向。
01
500強300弱的背後邏輯
自從我們在3月4日外發報告《爲什麼我們相對看好中證500——基於GK模型的收益預測》後,中證500指數累計上漲6.3%,而滬深300指數累計下跌4%,至今中證500已經創下了10.3%的超額收益。當前時點,有一部分投資者更加堅定了對中證500的信心,但也有部分投資者擔心中證500已經基本兌現未來收益。因此本文將基於GK模型再次論證未來一年內,中證500大概率仍將跑贏滬深300。
① 盈利方面中證500仍佔優勢。目前我們的A股盈利預測系統涵蓋自上而下宏觀預測模型和自下而上分析師預測模型,宏觀預測模型基於內生增長和信貸脈衝解決A股整體的盈利預測問題,而分析師預測模型基於對分析師預測誤差建模修正了A股長期高估的分析師預期問題。當前自上而下的宏觀模型預測300和500的預期盈利增速爲8.1%和9.0%,自下而上分析師模型預測300和500的預期盈利增速爲14.8%和17.6%,兩種盈利預測方法均顯示A股未來盈利有較強的韌性,且中證500的盈利優勢更大。
② 估值層面中證500有巨大的優勢。從圖表3和圖表4的歷史結果來看,ERP是預測未來一年估值變化的優秀變量。當前時點,滬深300的ERP處於歷史低位,而中證500的ERP卻處於歷史高位,根據A股估值預測系統,滬深300未來一年估值將回落3.8%,而中證500指數未來一年估值將上行13.5%,單從估值而言兩者拉開了近17%的差距。因此從安全邊際的角度來看,中證500無疑是進可攻退可守的高賠率資產。
③ 今年6月的指數成分調整打開了中證500的收益空間。今年6月各大寬基指數進行了一次成份股調整,GK模型是根據指數成分的加總進行預測,因此指數成分調整也必然影響指數的預期收益。從圖表5的結果來看,此次調整大幅降低了中證500的估值,從而讓中證500指數提升了近15%的預期收益。
④ 綜合來看,當前中證500的預期收益達20%。根據GK模型,股票收益來自於股息率、股本稀釋率、盈利增速和估值變化四個分項,當前中證500相對於滬深300無論在盈利維度還是在估值維度均具有優勢,中證500預期收益高達20%,而滬深300預期收益僅爲4.4%,預期收益上中證500存在巨大的優勢。因此我們認爲超配中證500ETF或中證500指數增強產品仍是未來的主要配置方向。
風險提示:以上結論均基於歷史數據和統計模型的測算,如果未來市場環境發生明顯改變,不排除模型失效的可能性。
Follow us
Find us on
Facebook,
Twitter ,
Instagram, and
YouTube or frequent updates on all things investing.Have a financial topic you would like to discuss? Head over to the
uSMART Community to share your thoughts and insights about the market! Click the picture below to download and explore uSMART app!

Disclaimers
uSmart Securities Limited (“uSmart”) is based on its internal research and public third party information in preparation of this article. Although uSmart uses its best endeavours to ensure the content of this article is accurate, uSmart does not guarantee the accuracy, timeliness or completeness of the information of this article and is not responsible for any views/opinions/comments in this article. Opinions, forecasts and estimations reflect uSmart’s assessment as of the date of this article and are subject to change. uSmart has no obligation to notify you or anyone of any such changes. You must make independent analysis and judgment on any matters involved in this article. uSmart and any directors, officers, employees or agents of uSmart will not be liable for any loss or damage suffered by any person in reliance on any representation or omission in the content of this article. The content of the article is for reference only and does not constitute any offer, solicitation, recommendation, opinion or guarantee of any securities, virtual assets, financial products or instruments. Regulatory authorities may restrict the trading of virtual asset-related ETFs to only investors who meet specified requirements. Any calculations or images in the article are for illustrative purposes only.
Investment involves risks and the value and income from securities may rise or fall. Past performance is not indicative of future performance. Please carefully consider your personal risk tolerance, and consult independent professional advice if necessary.


