行情太猛!超千隻基金竟負收益,腫了麼?
近幾日的行情,很讓人想起去年7月份指數啟動的特徵,在這波因為人民幣升值預期下,外資持續買入,以創業板為首,加上這週二的漂亮突破,上證指數、滬深300指數也都走出了一個非常好的趨勢。
很多成長股、白酒指數創新高,茅台被買爆,昨日茅台被淨買入4.84億,昨天淨買入11.35億,前天淨買入24.69億!
所以,在如此行情之下,基金的行情自然而然的會被帶動,但是基金君發現,截止到昨日,市場一萬多隻開放式基金中,依舊超兩千只的基金的收益在今年依舊是負,其中不乏存在東方紅,農銀匯理、廣發、景順等等知名機構的基金。
1、超千隻基金負收益
基金的好壞,最根本的就是看行情的好壞,在一季度較高的發行規模基礎之上,今年以來截止5月26日,新基金髮行總規模也已經突破1.3萬億元。2020年全年發行規模則為3.15萬億元。
在市場整體震盪背景下,新基金髮行市場繼續降温。據數據顯示,5月以來截止26日,共有95只新基金設立,合計發行規模1028億元,相比4月份1407億元的發行水平仍然有一大截差距,5月發行水平大概率會在年內各月中墊底。截至到現在今年已經有超130只基金清盤了,同期去年才只有50多隻,暴增144%。
根據wind數據顯示,全市場開放式基金超萬隻的背景下,負收益的基金數目也是超兩千只,可以看到,排名較前的基金幾乎是清一色的軍工類或者重倉軍工的基金,比如博時、長城、銀河、鵬華這些知名機構的基金,在今年的負收益超15%以上。
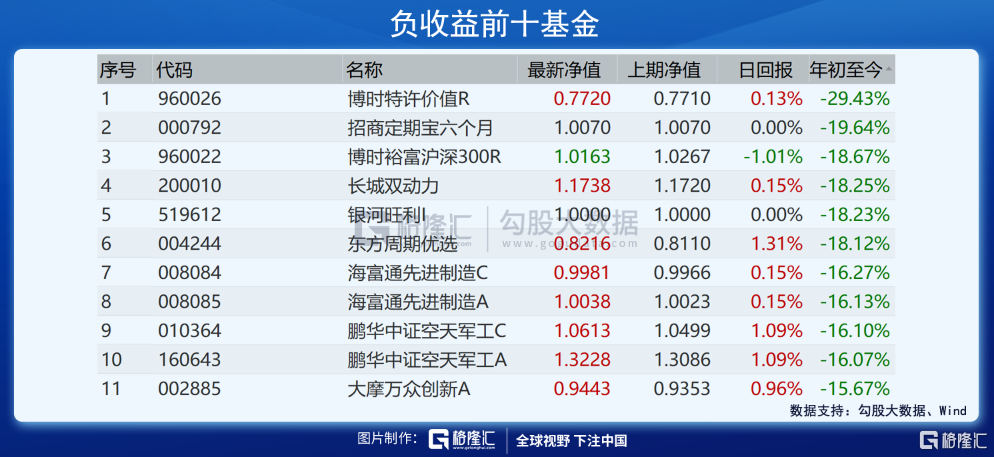
存在這個情況無非便是:重倉的標的至今沒有漲回去或者這些基金大部分的倉位是在年前的高點買進去導致現在依舊還被套牢當中。
值得一提的是,這些負收益的基金當中,比較知名的基金有東方紅睿遠三年定期,農銀匯理幾隻基金。
拿東方紅睿遠三年定期來看,從2015-01-21成立以來,已取得284.00%的收益,大於同類平均水平,同類排名暫無,期間資產淨值變化不詳。從各區間表現看,該基金今年以來收益率-9.28%,同類排名1949/1992;1年收益率37.93%,同類排名774/1908;3年收益65.37%,同類排名636/1672;5年收益195.16%,同類排名56/884。
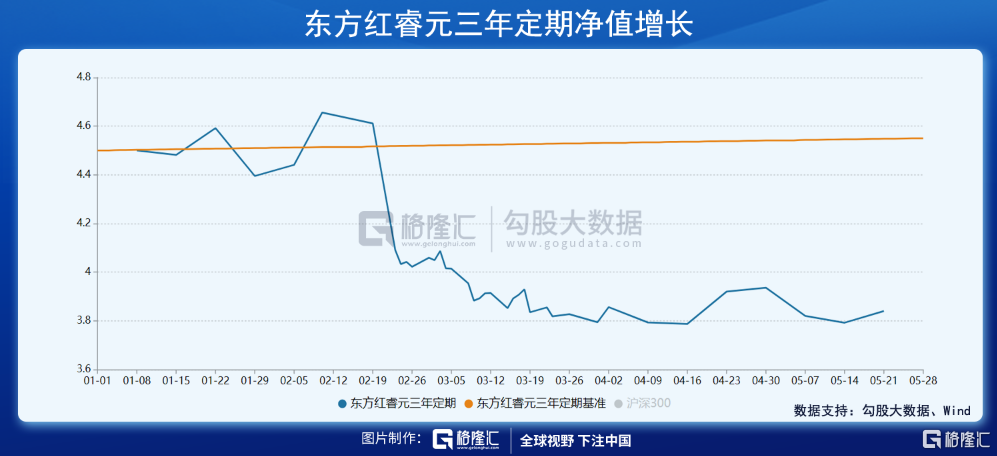
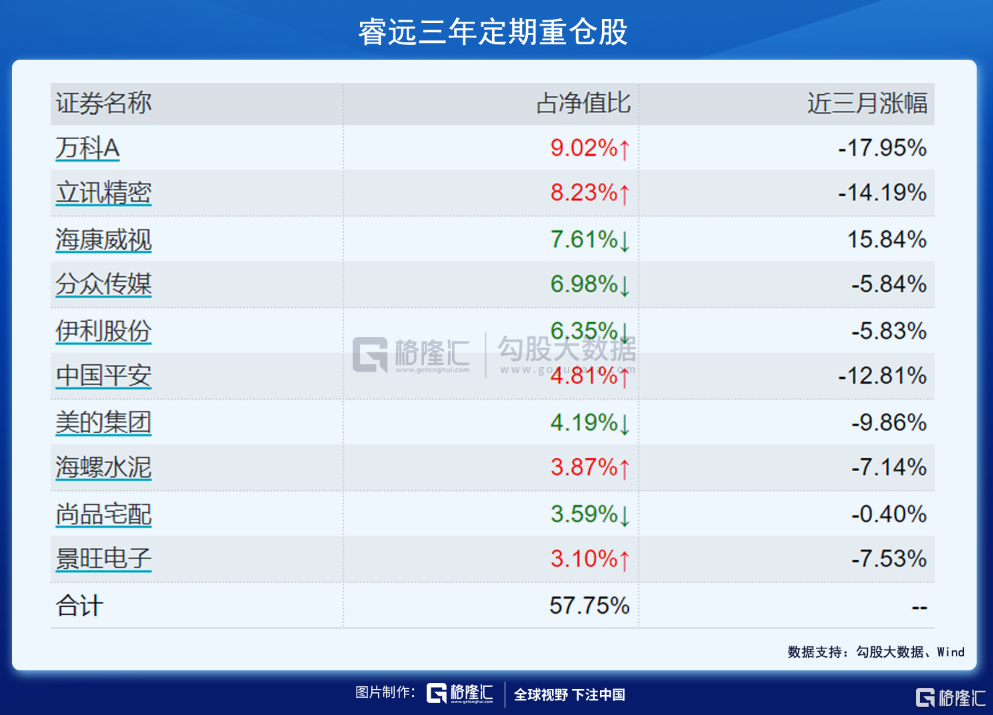
目前該基金的資金規模在43.43億元,屬於混合型基金,投資風格大盤成長類型基金,其倉位配置來看,截至到一季度末,其股票型資產佔比在74.89%,較上一季度減少20.53%。重倉股以製造業為主,前五大重倉股分別是:萬科、立訊精密、海康威視、分眾傳媒、伊利股份。
當前的基金經理是韓冬,任職總回報在148.54%,年化回報23.08%,在1240同類基金經理當中排在149位。值得一提的是,東方紅睿元三年定期的上任基金經理是林鵬,在2018年離任。
2、維度性問題
上述基金負收益,其實只是短期類,相信如果這些基金握有的優質品種和強於投資者一類的分析能力,估計會很快的讓基金回來,所以,引出的問題便是,投資者如何更好的去選擇基金。
首先,最重要的是有亮點:基金的品種和基金經理。
基金品種這塊,行業的ETF儘量的去選擇具備長期成長或者長期景氣前景的行業,目前A股這兩類當中非常明顯,無非便是:白酒、消費、新能源、光伏。而軍工這種ETF,很大程度限制於國防投入的預期,同時A股的風格軍工指數是高彈性的存在,同時科技ETF同樣如此。
比較適合投資者投資或者定投的基金品種以股票型基金為主,而這個最看重的就是基金經理。這個點,一般是以基金經理的投資年限加年化收益作為維度去參考。
以A股來看,牛熊轉換五到7年的時間,那麼投資的年限就在這裏,那麼優質的基金經理應該要經受牛熊轉換週期走出來的實力。同時曾經基金規模至少10億以上以及年化收益20%以上。
近兩年,結構性的牛市使得押寶某行業大賺,讓一些基金經理封神,但是投資者選擇基金的同時,更應該是拋開近兩年的因素,從長遠的角度去出發挑選。所以,在這一輪刷選下來,其實能夠選擇的基金經理,投資者眾位其實心裏有數了。
Follow us
Find us on
Facebook,
Twitter ,
Instagram, and
YouTube or frequent updates on all things investing.Have a financial topic you would like to discuss? Head over to the
uSMART Community to share your thoughts and insights about the market! Click the picture below to download and explore uSMART app!

Disclaimers
uSmart Securities Limited (“uSmart”) is based on its internal research and public third party information in preparation of this article. Although uSmart uses its best endeavours to ensure the content of this article is accurate, uSmart does not guarantee the accuracy, timeliness or completeness of the information of this article and is not responsible for any views/opinions/comments in this article. Opinions, forecasts and estimations reflect uSmart’s assessment as of the date of this article and are subject to change. uSmart has no obligation to notify you or anyone of any such changes. You must make independent analysis and judgment on any matters involved in this article. uSmart and any directors, officers, employees or agents of uSmart will not be liable for any loss or damage suffered by any person in reliance on any representation or omission in the content of this article. The content of the article is for reference only and does not constitute any offer, solicitation, recommendation, opinion or guarantee of any securities, virtual assets, financial products or instruments. Regulatory authorities may restrict the trading of virtual asset-related ETFs to only investors who meet specified requirements. Any calculations or images in the article are for illustrative purposes only.
Investment involves risks and the value and income from securities may rise or fall. Past performance is not indicative of future performance. Please carefully consider your personal risk tolerance, and consult independent professional advice if necessary.


