2021年Q1美國手遊市場:總收入61億美元,中國手遊佔24%,出口優勢進一步擴大
本文來自: SensorTower,作者:Nan Lu
Sensor Tower 商店情報數據顯示,2021年Q1美國手遊在App Store和Google Play的總收入超過61億美元。本期,共23款中國手遊產品入圍美區暢銷榜Top100,吸金近10億美元,拿下24%的市場份額,是近年來表現最好的季度。同時,美區下載榜榜首迎來首款中國廠商原創作品,中國手遊在美出口優勢進一步擴大,詳細分析如下。
美國手遊市場規模
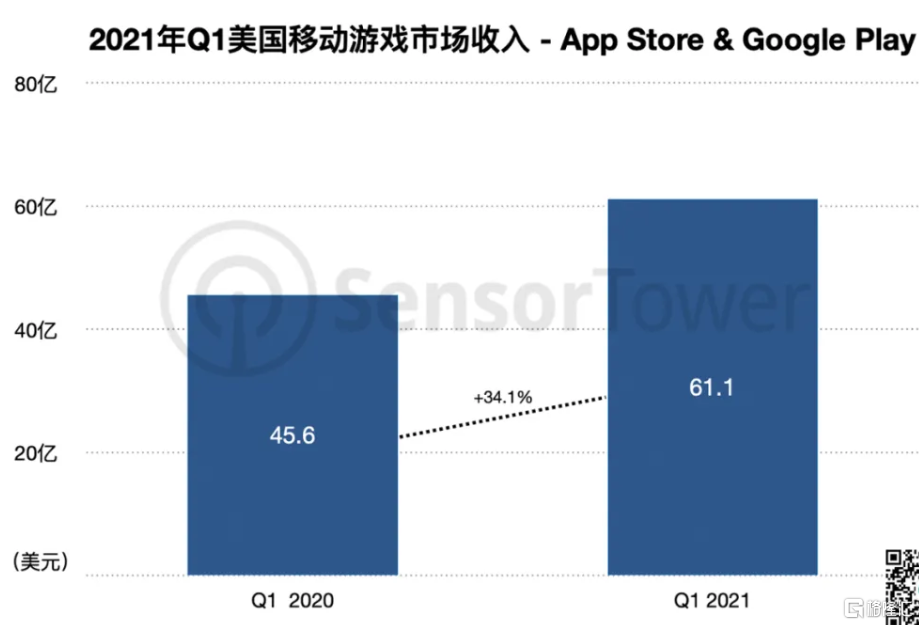
美國手遊市場收入在經歷去年Q3和Q4短暫回調後,本期重回61億美元,較2020年Q1增長34.1%,佔全球App Store和Google Play手遊總收入的27.5%。其中,來自App Store收入佔比為54.5%,Google Play佔45.5%。
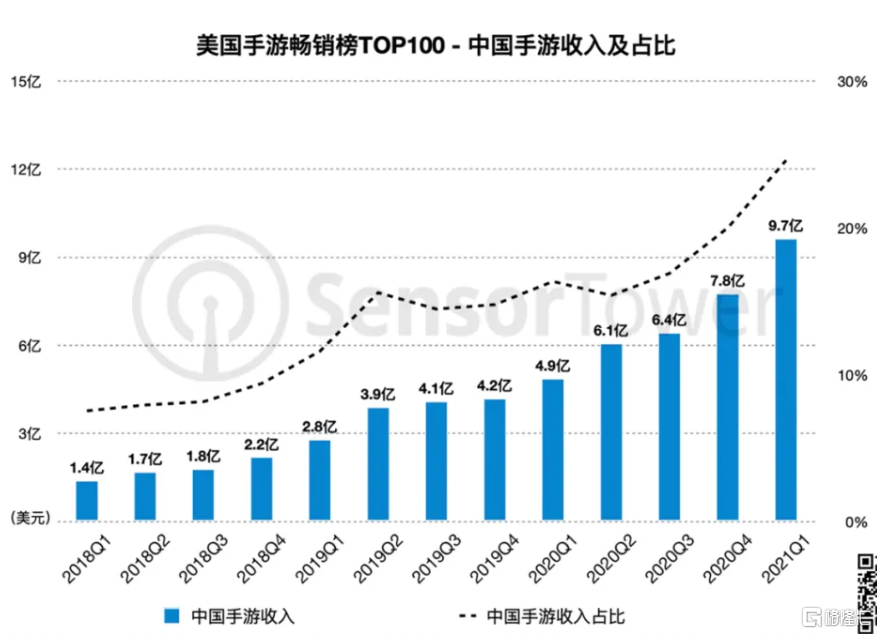
隨着中國手遊海外發行經驗的積累,不少企業將高收入高增長的美國市場提升至戰略重點,其成效也十分顯著 。本期共23款中國手遊入圍美區暢銷榜TOP100,合計吸金9.7億美元,佔TOP100總收入的24.6%。
作為對比,2020年Q1入圍美區暢銷榜TOP100的中國手遊總收入僅4.9億美元。過去一年,頭部中國手遊在美國的收入實現了翻倍增長,增速顯著高於美國大盤,中國手遊對美出口優勢進一步擴大。
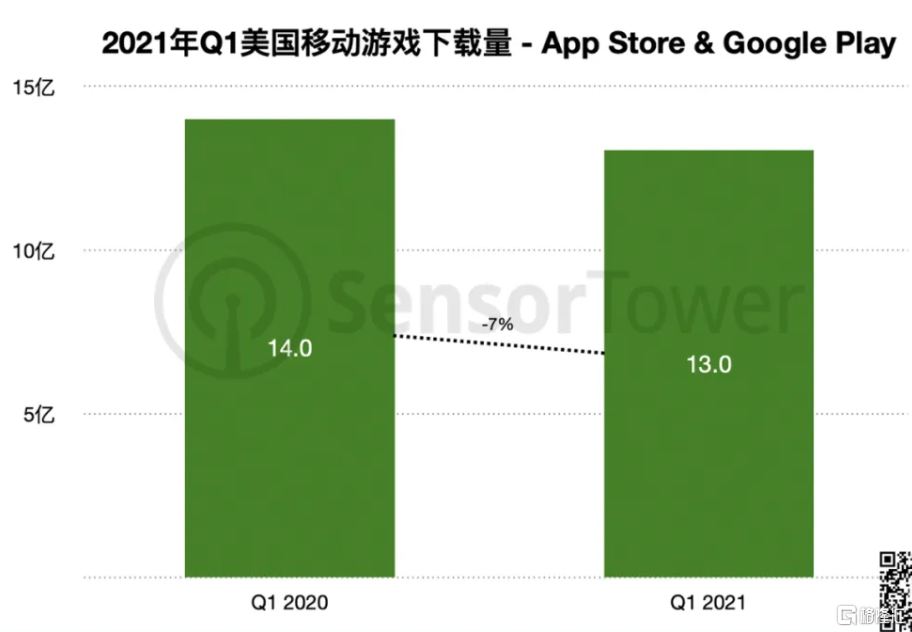
Q1美國App Store和Google Play手遊總下載量回升至13億次,但仍比去年同期疫情剛爆發時減少7%。其中,App Store手游下載量佔51%,Google Play佔49%。
美國市場熱門手遊
隨着疫情緩解,學生陸續返校。但過去一年,Z世代在移動互聯網的娛樂習慣已經養成,並直接表現為《Roblox》在榜單的位置。Q1該遊戲移動端收入為2.1億美元,與上個季度持平,依然是美區收入最高的手遊,比第2名《糖果粉碎傳奇》高出28%。
值得留意的是,榜單中除了《Bingo Blitz™》和《糖果粉碎蘇打傳奇》,其它實現收入增長的均是中國手遊。其中,《王國紀元》和《Project Makeover》增速最快,分別達到209%和247%。經歷過去幾年的探索,頭部中國廠商在美國市場已經建立起一套卓有成效的運營體系。
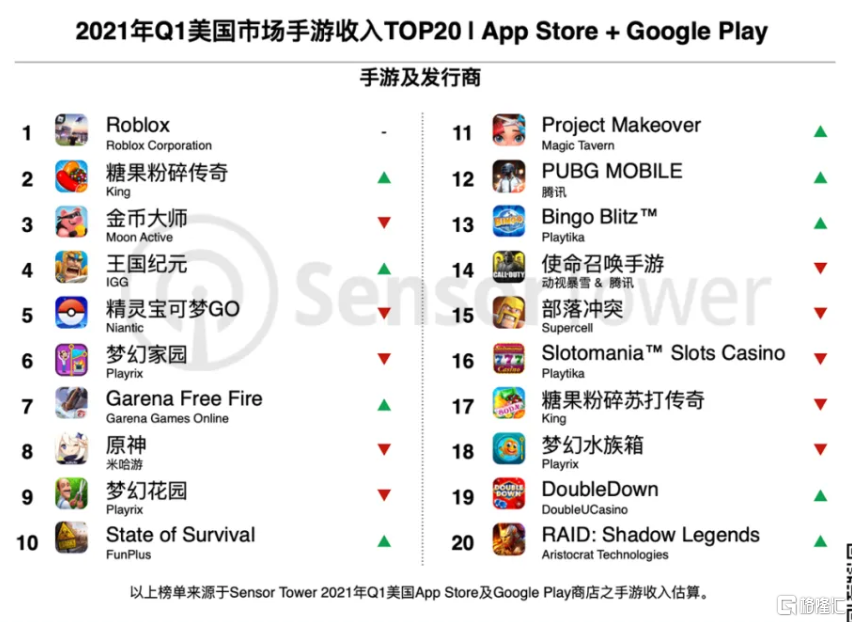
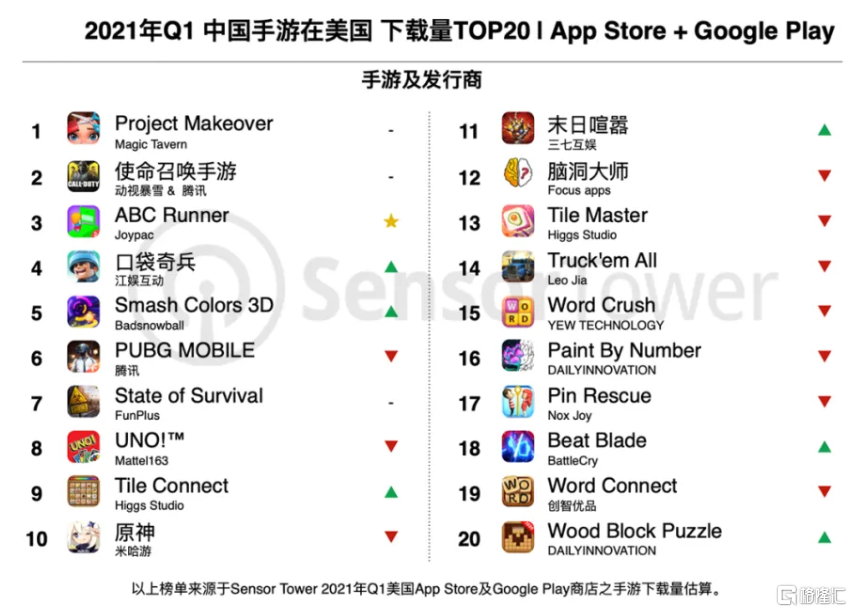
下載榜中,在AppLovin的流量加持下,《Project Makeover》以超過1000萬次下載超越Zynga新遊《High Heels!》,登頂榜首。這是首款不依賴IP,以創新的題材和玩法成功打開美國大眾手遊市場的中國產品。《Project Makeover》的成功,也反映出AppLovin在超休閒遊戲之外,提升流量變現效率的戰略成果。
中國手遊在美國
IGG《王國紀元》Q1在美國App Store和Google Play吸金近1.4億美元,登頂國產手遊收入榜。與2020年Q4相比,該遊戲在美收入環比激增209%,在刷新自身記錄的同時,也打破中國手遊在美收入的天花板。此前的紀錄由米哈遊《原神》在去年Q4創下,達到1.07億美元。
榜單中,收入較上個季度增長1倍以上的產品的還有Magic Tavern《Project Makeover》、江娛互動《口袋奇兵》和三七互娛《末日喧囂》。

下載榜中,《Project Makeover》以超過1000萬次下載蟬聯榜首,相較去年Q4增長60%。Joypac於1月下旬推出超休閒遊戲《ABC Runner》,Q1該遊戲在美區獲得近360萬次下載,成為榜單中唯一的新面孔。
榜單中增長最快的遊戲為Badsnowball音樂手遊《Smash Colors 3D 》。該遊戲於去年7月底登陸美國市場,本期下載量超過220萬次,是去年Q4的三倍。Sensor Tower廣吿情報數據顯示,AppLovin和AdMob是該遊戲在美國的主要投放渠道。
Follow us
Find us on
Facebook,
Twitter ,
Instagram, and
YouTube or frequent updates on all things investing.Have a financial topic you would like to discuss? Head over to the
uSMART Community to share your thoughts and insights about the market! Click the picture below to download and explore uSMART app!

Disclaimers
uSmart Securities Limited (“uSmart”) is based on its internal research and public third party information in preparation of this article. Although uSmart uses its best endeavours to ensure the content of this article is accurate, uSmart does not guarantee the accuracy, timeliness or completeness of the information of this article and is not responsible for any views/opinions/comments in this article. Opinions, forecasts and estimations reflect uSmart’s assessment as of the date of this article and are subject to change. uSmart has no obligation to notify you or anyone of any such changes. You must make independent analysis and judgment on any matters involved in this article. uSmart and any directors, officers, employees or agents of uSmart will not be liable for any loss or damage suffered by any person in reliance on any representation or omission in the content of this article. The content of the article is for reference only and does not constitute any offer, solicitation, recommendation, opinion or guarantee of any securities, virtual assets, financial products or instruments. Regulatory authorities may restrict the trading of virtual asset-related ETFs to only investors who meet specified requirements. Any calculations or images in the article are for illustrative purposes only.
Investment involves risks and the value and income from securities may rise or fall. Past performance is not indicative of future performance. Please carefully consider your personal risk tolerance, and consult independent professional advice if necessary.


