面板高景氣,價格連漲11月!京東方A更1年暴漲80%
做過投資的人應該都知道一句話,方向不對努力白費。而這個方向如果是有不錯的景氣度支撐且疊加行業漲價消息刺激,則大概率不會差。
顯然,目前的面板行業肯定算一個方向。
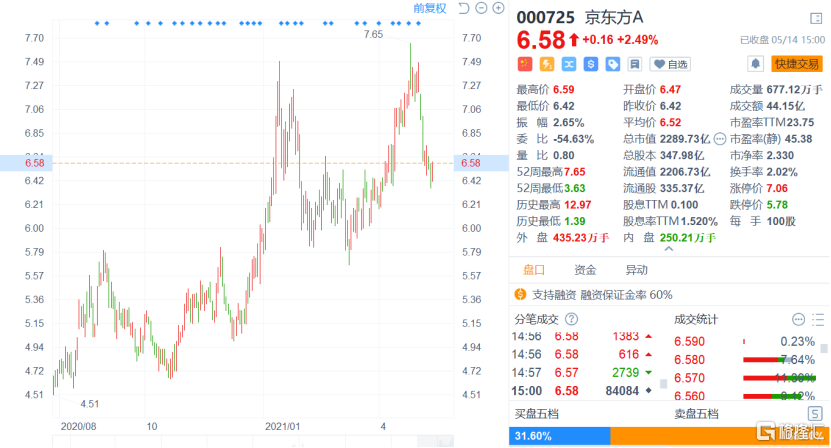
來源:富途牛牛
僅從二級市場的走勢判斷,行業龍頭京東方A從去年最低價3.65塊一路趨勢小跑至今天收盤價6.58塊,漲幅達到了80%!而另一龍頭TCL科技更是從去年最低價4.03塊到今天收盤價8.54塊,漲幅達到了驚人的100%!
作為看戲的投資者,不僅要問,面板雙龍股價表現如此凌厲的背後到底是什麼刺激?
答案就是,離不開面板行業景氣度的驅動。
據中信證券統計,4月電視面板價格全面上漲,環比上漲6.0%-12.0%超預期。自20年5月低點至21年4月已連續11個月全面上漲,期間32寸、43寸、50寸、55寸、65寸漲幅分別為157.6%、92.8%、123.3%、101.9%、65.1%,年初至今相應尺寸漲幅分別為25.0%、13.7%、 23.1%、18.7%、18.6%。
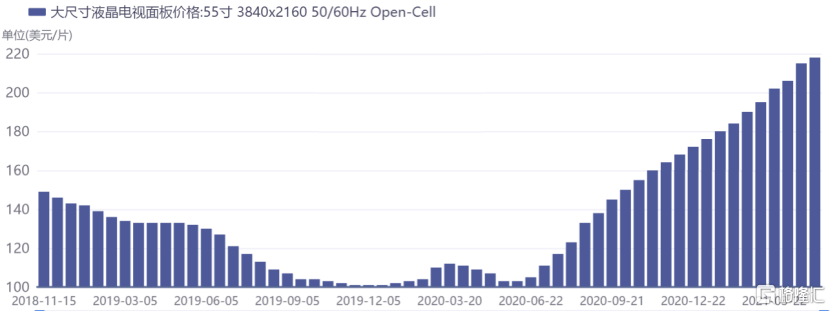
來源:IFInD
但以上只是面板行業漲價的冰山一角。
此外,還有以平板筆電為代表的中尺寸面板,4月平板漲幅2.6-3.2%,筆電漲幅3.3-7.5%。自20年5月低點至今連續11個月全面上漲,平板漲幅18.1-22.0%,筆電漲幅15.4-50.6%;年初至今平板漲幅8.1%-10.1%,筆電漲幅9.3%-22.0%。
以及以手機為代表的小尺寸面板市場,供需仍緊,價格穩中有漲。自20年5月至21年4月,小尺寸累計漲幅3.7%-37.5%;年初至今漲幅15.8%以內。
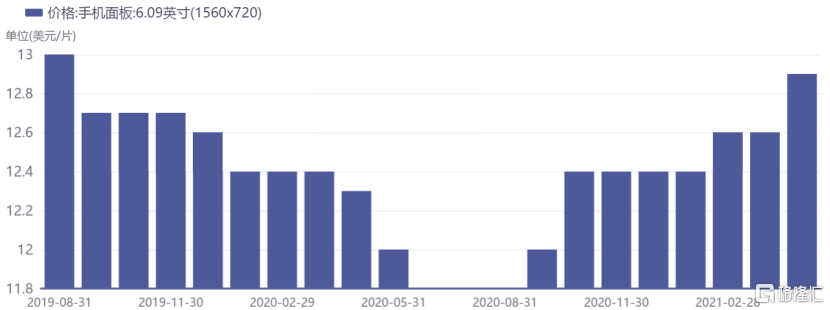
來源:IFInD
可見,對於面板行業,無論是大中小各尺寸都是雞犬升天式的普漲,而這種價格連續上漲的背後,一定是行業的供給與需求矛盾較為突出所致。
一方面,在需求端,一季度海外需求維持強勁,品牌及渠道庫存偏低,備貨需求維持高位。大尺寸由於宅經濟帶動加之財政刺激政策持續,海外終端需求向好,中尺寸主要系後疫情時代在線教育、居家辦公趨勢下中尺寸面板需求強勁,而小尺寸需求端,終端需求復甦、手機廠搶佔市場疊加供應鏈緊張促使廠商積極備貨。
另一方面,在供給端,面板上游材料嚴重短缺,對面板的實際出貨產生了一定的衝擊。大尺寸的上游原材料缺口逐步放大短期難補,限制面板廠實際產能。直觀看,AGC減少6代玻璃供應,康寧提高顯示屏用玻璃基板價格,IC短缺難解,供應鏈緊張情緒促使整機廠採購計劃偏向激進,供不應求局面不改。
中尺寸方面,供應廠供給計劃低於品牌商採購計劃,供需缺口難解,目前TCON提價拉昇部分面板價格,中尺寸價格上漲趨勢延續。而小尺寸方面,在供給端的上游,TDDI、驅動IC等零部件ASP持續上漲拉昇BOM成本,疊加玻璃基板供給趨緊。IC緊張下面板廠商優先供應更大的智能手機面板,或促進較小尺寸供給趨緊。
此外,從去年至今反覆的疫情,對面板的供給端也產生了不小的擾動。尤其是在面板行業佔據主導地位的韓國,一季度以來隨着疫情加重,三星以及LG旗下工廠多次停工。長期來看,在持續虧損、多做多虧的壓力下,韓國和中國台灣地區面板廠商不斷降低液晶面板產能,加速退出全球面板市場。
總之,各尺寸供需缺口仍緊,面板行業景氣度短期依舊有望延續。
受益於行業景氣度提升,相關上市公司一季報業績也大幅增長。其中最為受益的,肯定是國內雙寡頭的京東方與TCL科技。
京東方A一季報顯示,一季度營收同比增長107.87%,歸母淨利潤同比增長814.46%。TCL科技一季報顯示,一季度營收同比增長133.91%,歸母淨利潤同比增長488.97%。
對於業績增長的原因,上述兩家公司均提到與行業景氣度提升、產品價格上漲以及新項目產能釋放等因素有關。其中京東方A的成都柔性AMOLED產能不斷釋放,還有綿陽柔性AMOLED量產出貨。
説了這麼多,相信如果你是從去年開始就一直持有面板行業的投資者來説,你應該可以感受到什麼叫做景氣度提升疊加漲價刺激,從而帶來的穩穩的幸福。
Follow us
Find us on
Facebook,
Twitter ,
Instagram, and
YouTube or frequent updates on all things investing.Have a financial topic you would like to discuss? Head over to the
uSMART Community to share your thoughts and insights about the market! Click the picture below to download and explore uSMART app!

Disclaimers
uSmart Securities Limited (“uSmart”) is based on its internal research and public third party information in preparation of this article. Although uSmart uses its best endeavours to ensure the content of this article is accurate, uSmart does not guarantee the accuracy, timeliness or completeness of the information of this article and is not responsible for any views/opinions/comments in this article. Opinions, forecasts and estimations reflect uSmart’s assessment as of the date of this article and are subject to change. uSmart has no obligation to notify you or anyone of any such changes. You must make independent analysis and judgment on any matters involved in this article. uSmart and any directors, officers, employees or agents of uSmart will not be liable for any loss or damage suffered by any person in reliance on any representation or omission in the content of this article. The content of the article is for reference only and does not constitute any offer, solicitation, recommendation, opinion or guarantee of any securities, virtual assets, financial products or instruments. Regulatory authorities may restrict the trading of virtual asset-related ETFs to only investors who meet specified requirements. Any calculations or images in the article are for illustrative purposes only.
Investment involves risks and the value and income from securities may rise or fall. Past performance is not indicative of future performance. Please carefully consider your personal risk tolerance, and consult independent professional advice if necessary.


