華東醫藥2日挫17%,愛美客挫16%!醫美超級泡沫破裂了嗎?
進入4月份以來,醫美板塊持續拉昇,博得市場青睞。短短一個月內,“醫美概念”指數漲幅高達40%,遠超同期創業板和上證指數的漲幅。不過,這兩天高位的醫美板塊出現大幅下跌態勢,最強的醫美“黑馬”華東醫藥2日跌逾17%;下游區域連鎖龍頭朗姿股份今日跌停;龍頭愛美客2日重挫16%;華熙生物則大跌9%以上。
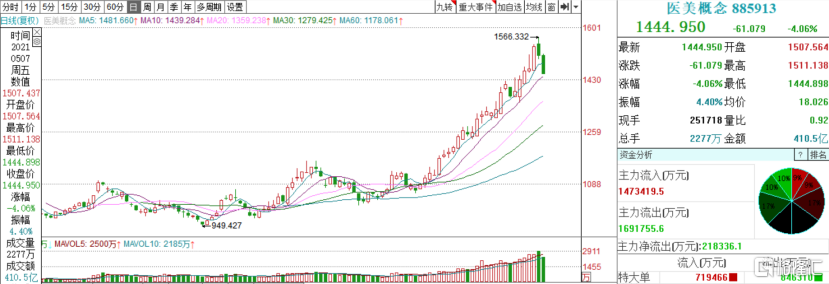
(來源:同花順)
究其原由,主要是伴隨着前期股價上漲,累積了一定泡沫,存在回調的風險。
高景氣及政策加持,板塊前期漲幅巨大
醫美概念股無疑是今年最火熱的板塊之一,愛美客股價自今年3月底部以來,最高反彈了60%;華熙生物亦有50%以上的漲幅;華東醫藥自2月宣佈佈局醫美業務之後,其股價最大漲幅高達89.52%;朗姿股份在過去半年的時間內,其股價翻了5倍有餘,可謂強勢。
板塊火熱的背後無疑是醫美廣闊的增長空間以及政策加持。
2018年中國已成為第二大醫療美容服務市場,佔全球市場約13.5%的市場份額。數據顯示,2019年中國醫美行業市場規模達到了1769億元,同比增長22%,預計2023中國醫美市場規模將拓展至3115億元。其中,非手術類的“輕醫美”服務由於低風險、輕疼痛和恢復時間短,消費者接受程度更高,增長速度更快,預計從2018年到2023年複合增長率可達26.3%。
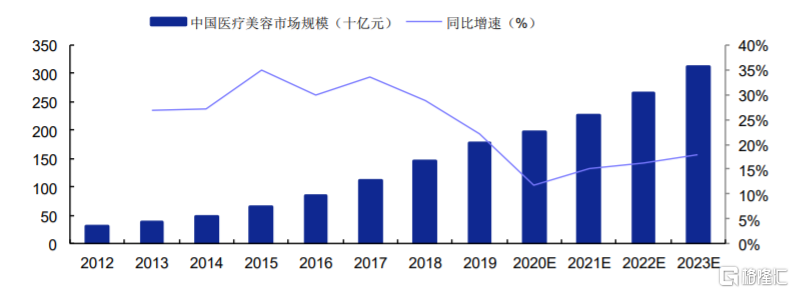
(2012-2023年中國醫美市場規模(十億元),來源:安信證券)
從滲透率來看,我國醫美行業滲透率從2014年的2.4%提高至2019年的3.6%,整體呈現穩步增長態勢。對標醫美行業相對成熟的美國、日本、韓國,2019年三國滲透率分別高達16.6%、11%和20.5%,差距依然較大。目前,我國每千人中接受醫療美容診療的人數僅為14.5人,而美國每千人中接受醫療美容診療的人數52.2人、韓國達89.2人,受益於滲透率提升,未來醫美的增長空間相當大。
除此之外,政策加持亦給火熱的醫美賽道火上澆油。
近期,深圳擬大力拓展高質量服務消費新場景,出台政策加快推動醫美、美髮美粧等服務消費產業高質量發展。圍繞醫美產業研發端、應用端和消費端等關鍵環節,加強規劃佈局和產業扶持,吸引人才、資金和市場主體加快聚集,培育“美麗經濟”新賽道的領先企業,打造國際知名“醫美之都”。
值得注意的是,儘管醫美賽道確定性較高,但短期爆炒帶來估值泡沫。
拿華東醫藥來説,其估值水平常年在15倍-20倍之間。近2個月以來,其PE-TTM最高衝至38倍,這幾天回落後,公司的估值還有34倍,處於歷史較高位置。
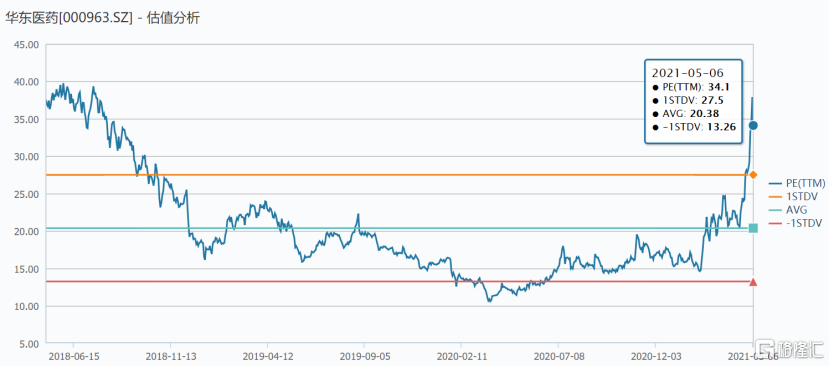
(來源:wind)
華熙生物亦是如此,當前公司PE-TTM達141倍,遠高於歷史平均水平。
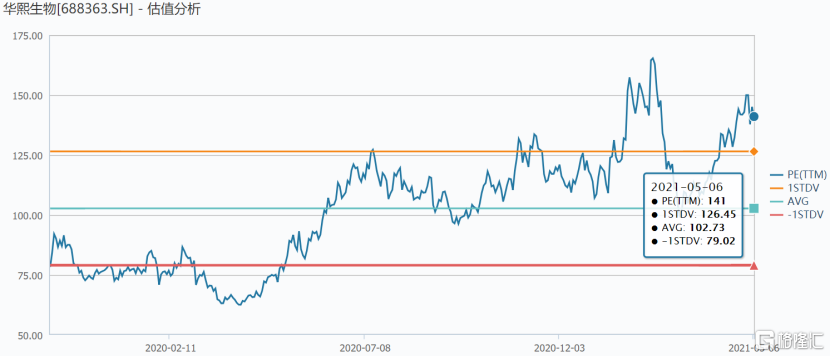
(來源:wind)
從投資的角度來看,在短期情緒支配的背後,醫美板塊已累積了不少估值泡沫風險,而醫美企業最終受益幾何,取決於其產品線及市場營銷能力,後續如若業績釋放不出來,可能會有更大一波估值回調的可能。
不少公司加碼佈局,賽道擁擠
除此之外,正值醫美風口上,不少公司和資本亦加速競逐佈局。從醫美機構數量來看,2010-2019年中國的整形醫院數量增長緩慢,從38家增至53家。相比之下,美容醫院數量不斷增長,從2010年的82家快速增至2019年的477家。
昨日,以臨牀醫療管理信息系統系列應用軟件產品和臨牀信息化整體解決方案為核心業務的麥迪科技宣佈進軍醫美市場,公司擬以現金支付方式收購美貝爾集團持有的蘇州美貝爾美容醫院與常熟瑞麗美貝爾醫院各不少於80%的股權,標的公司100%股權初步整體估值合計暫定為2.9億元。
相較於下游機構快速擴張,醫美上游不僅“錢”景廣闊且毛利率超高,更獲資本青睞。今年2月,昊海生科通過受讓股權、增資等方式,以2.05億元的總投資款獲得歐華美科63.64%的股權,同時公司參股法國創新型生物材料研發公司股權。
華東醫藥也在今年2月,以6500萬歐元股權對價款及最高不超過2000萬歐元銷售里程碑付款,收購Cocoon公司持有的西班牙能量源型醫美器械公司HighTech公司100%股權,介入身體塑形和皮膚修復兩大醫美領域。
不過,對於今年介入醫美的公司而言,現在僅有醫美概念,而具體醫美業務能帶來多大的業績增長空間,還未可知,若沒有業績支撐,最後恐怕也是一地雞毛。
Follow us
Find us on
Facebook,
Twitter ,
Instagram, and
YouTube or frequent updates on all things investing.Have a financial topic you would like to discuss? Head over to the
uSMART Community to share your thoughts and insights about the market! Click the picture below to download and explore uSMART app!

Disclaimers
uSmart Securities Limited (“uSmart”) is based on its internal research and public third party information in preparation of this article. Although uSmart uses its best endeavours to ensure the content of this article is accurate, uSmart does not guarantee the accuracy, timeliness or completeness of the information of this article and is not responsible for any views/opinions/comments in this article. Opinions, forecasts and estimations reflect uSmart’s assessment as of the date of this article and are subject to change. uSmart has no obligation to notify you or anyone of any such changes. You must make independent analysis and judgment on any matters involved in this article. uSmart and any directors, officers, employees or agents of uSmart will not be liable for any loss or damage suffered by any person in reliance on any representation or omission in the content of this article. The content of the article is for reference only and does not constitute any offer, solicitation, recommendation, opinion or guarantee of any securities, virtual assets, financial products or instruments. Regulatory authorities may restrict the trading of virtual asset-related ETFs to only investors who meet specified requirements. Any calculations or images in the article are for illustrative purposes only.
Investment involves risks and the value and income from securities may rise or fall. Past performance is not indicative of future performance. Please carefully consider your personal risk tolerance, and consult independent professional advice if necessary.


