券商分倉佣金去年大增八成!中信、長江、中信建投蟬聯三甲
本文來自格隆匯專欄:上海證券報,作者:陸海晴 徐蔚
去年,A股市場結構性行情持續演繹,公募基金賺錢效應顯現,權益基金規模大增。在此背景下,去年券商的基金分倉佣金收入超過135億元,較2019年增加逾60億元。
頭部券商的優勢地位越來越突出,中信證券繼續蟬聯冠軍寶座,與第二名長江證券的差距有所拉開。
中信、長江、中信建投坐穩前三名
天相投顧數據顯示,公募基金2020年年報披露的股票交易量為17.1萬億元,2019年為9.25萬億元,同比增長84.75%。由於股票交易量大幅增加,這使得券商的基金分倉佣金收入較2019年同比增長近80%。
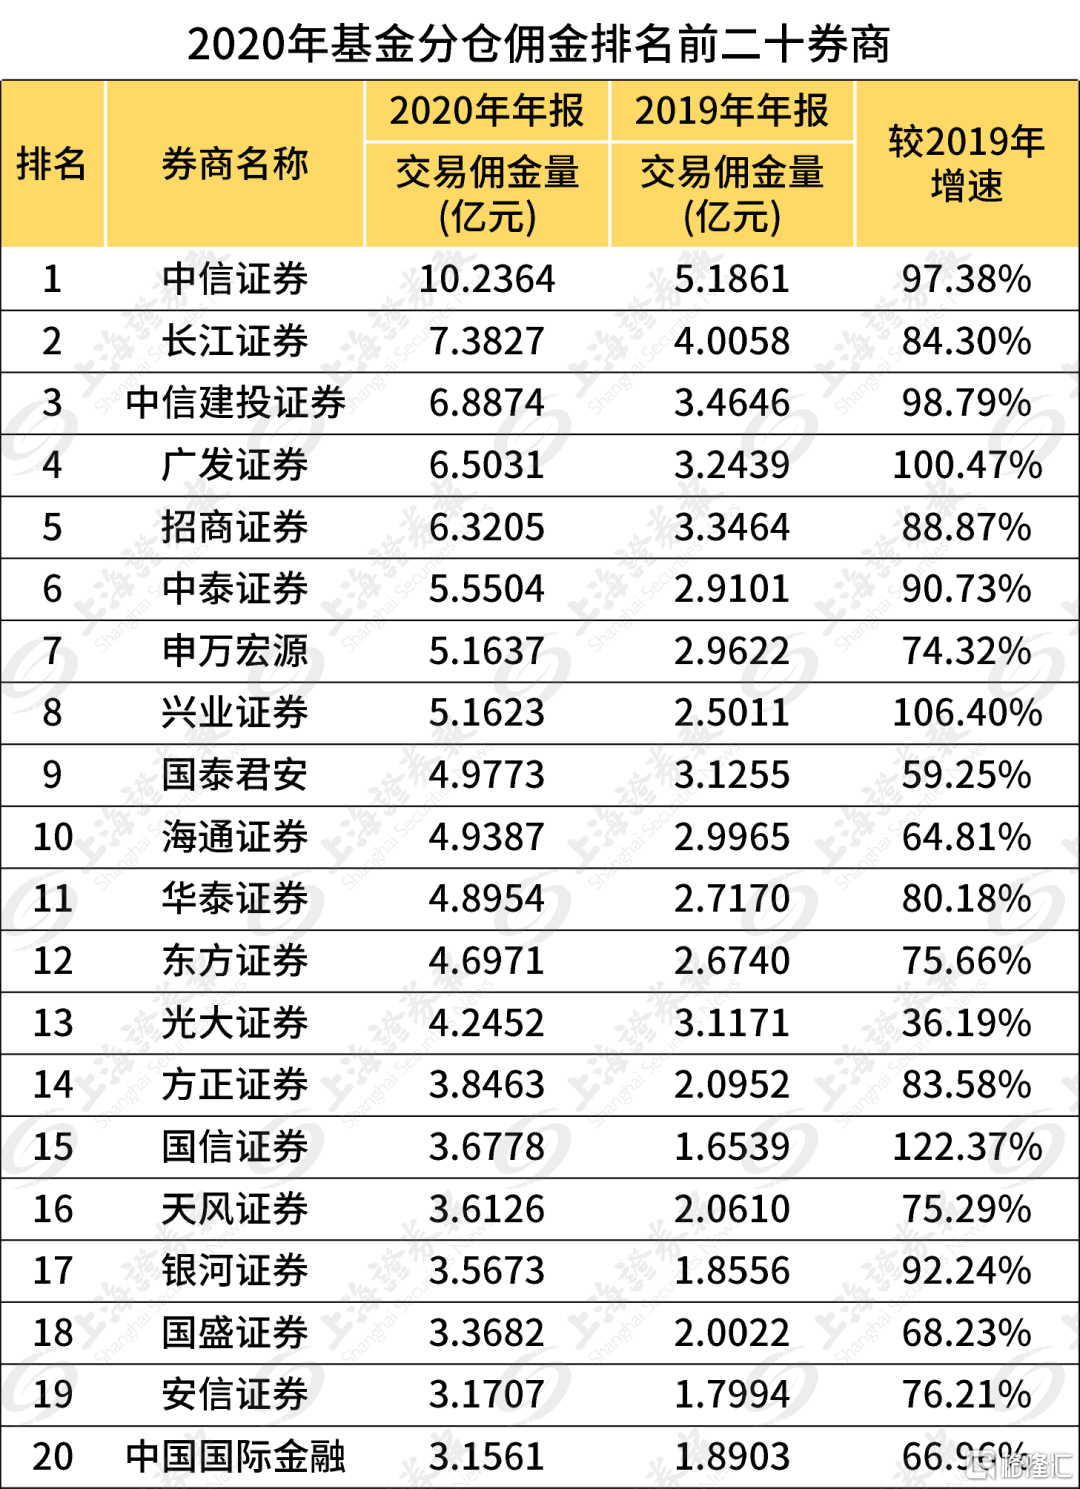
從整體來看,共有31家券商的分倉佣金收入超過1億元,其中,中信證券、長江證券、中信建投證券、廣發證券、招商證券等8家券商的分倉佣金收入超過5億元。
去年分倉佣金排名前三的券商與2019年保持一致。具體來看,中信證券分倉佣金高達10.24億元,較2019年同比增長超過97%,再度蟬聯冠軍寶座;長江證券以7.38億元的分倉佣金位列第二,較2019年同比增長84.3%;排名第三的中信建投證券分倉佣金也實現高速增長,較2019年同比增長98.79%。
不過,第4-10名的位置出現較大變化。和2019年相比,老牌券商申萬宏源迎頭趕上,排名從第13名升至第7名,作為發力研究業務的中小券商代表,中泰證券延續黑馬之姿,排名從第9名升至第6名。
有人歡喜有人愁,海通證券排名下滑4位,光大證券則退出前十名,滑落至第13名。值得注意的是,光大證券和海通證券均有明星分析師流失:光大證券迎來一輪較大範圍的人事動盪,研究所所長、副所長、所長助理先後離職;海通證券姜超的離任也是轟動業界。
在公募股票交易量大增的這一年,有券商借機實現快速增長。具體來看,29家券商分倉收入翻倍,例如,國海證券分倉佣金收入同比增長223.25%,排名也從92升至48,類似的還有東海證券,分倉佣金收入增長475.9%,排名上升15位。
也有券商錯過此次機會。11家券商分倉收入同比增速為負,例如,國融證券、華融證券、愛建證券排名均有所下滑。
萬八模式有待終結
二級市場交易活躍,為券商帶來豐厚的佣金收入。不過,機構整體的佣金率仍在下降。
一直以來,基金公司與券商之間的佣金費率約定俗成地定在萬分之八,俗稱“機構批發價”。去年,公募基金股票交易量大增,但基金租用券商席位支付的佣金佔股票交易量的比例則下降到萬分之八之下。
從具體的機構來看,已有不少佣金排名居前的券商對機構客户率先降傭。
數據顯示,佣金排名前十的券商中,中信證券、中信建投、廣發證券、招商證券的整體佣金率均低於萬八,其中,中信建投佣金率僅萬六八。
有業內人士認為,下調分倉佣金率則大勢所趨。買賣雙方正在進行激烈博弈,目前來看,佔主動權的應該是買方即機構投資者。可以預見的是,下調佣金率會對賣方研究未來的格局產生巨大影響。
有賣方人士指出,券商研究所目前有兩個應對措施:第一是開拓客户範圍,比如增加保險、QFII、私募等;第二,轉向內部支持,研究所與上市公司及資本市場溝通密切,為投行等其他部門爭取業務或提供服務。
Follow us
Find us on
Facebook,
Twitter ,
Instagram, and
YouTube or frequent updates on all things investing.Have a financial topic you would like to discuss? Head over to the
uSMART Community to share your thoughts and insights about the market! Click the picture below to download and explore uSMART app!

Disclaimers
uSmart Securities Limited (“uSmart”) is based on its internal research and public third party information in preparation of this article. Although uSmart uses its best endeavours to ensure the content of this article is accurate, uSmart does not guarantee the accuracy, timeliness or completeness of the information of this article and is not responsible for any views/opinions/comments in this article. Opinions, forecasts and estimations reflect uSmart’s assessment as of the date of this article and are subject to change. uSmart has no obligation to notify you or anyone of any such changes. You must make independent analysis and judgment on any matters involved in this article. uSmart and any directors, officers, employees or agents of uSmart will not be liable for any loss or damage suffered by any person in reliance on any representation or omission in the content of this article. The content of the article is for reference only and does not constitute any offer, solicitation, recommendation, opinion or guarantee of any securities, virtual assets, financial products or instruments. Regulatory authorities may restrict the trading of virtual asset-related ETFs to only investors who meet specified requirements. Any calculations or images in the article are for illustrative purposes only.
Investment involves risks and the value and income from securities may rise or fall. Past performance is not indicative of future performance. Please carefully consider your personal risk tolerance, and consult independent professional advice if necessary.


