熱點掃描 | 港股低開高走,煤炭板塊強勢領漲
uSMART盈立智投3月29日消息,港股今日低開高走,截至10:49,恆生指數翻紅漲0.29%,報28418.21,成交額700.51億。國企指數漲0.20%。恆生科技指數成分股漲跌互現,現小幅下跌0.20%。港股通淨流入5.77億。
煤炭股領漲大市,截至10:32,兗州煤業股份大漲超16%,該公司與兗礦集團訂立化工原料煤採購及產品銷售協議。中國神華大漲超10%,擬將九成利潤用來分紅,大超市場預期。蒙古能源漲超8%,中煤能源漲超6%,蒙古焦煤漲超3%,匯力資源漲超2%,首鋼資源漲超2%。
零售股走強,截至10:32,六福集團漲超6%,周大福漲超6%,利福國際漲超4%,莎莎國際漲超5%,卓越控股漲超2%,周生生漲超2%。中信證券近日指出,香港本地零售股的最壞時期已經過去,且負面因素已基本反映在此前的股價中,但市場短期內仍會面臨一定的挑戰,復甦速度或將較慢。
券商股表現亮眼,截至10:32,恆投證券大漲超26%,廣發證券漲超9%,,華泰證券漲超7%,中信證券漲超6%,海通證券漲超6%,中國銀河漲超6%,中金公司漲超6%。
內房股走高,截至10:32,中國恆大漲超7%,該公司將出售子公司房車寶股份,投資總代價163.5億港元(80.8%)權益。龍湖集團漲超6%,時代中國控股漲超6%,中國奧園漲超6%,旭輝控股漲超5%,世茂集團漲超5%,融創中國漲超4%,中國金茂漲超5%,綠城中國漲超4%,融創中國漲超4%。
物業板塊延續上週強勢,截至10:32,綠城服務大漲超14%,時代鄰裏漲超7%,建業新生活漲超6%,碧桂園服務漲超6%,新城悅服務漲超5%,宋都服務漲超5%,奧園健康漲超5%,中海物業漲超5%,恆大物業漲超3%。
石油板塊表現活躍,截至10:32,中國石油化工股份漲超5%,該公司發盈喜,料首季純利介乎160億元至180億元人民幣。上海石油化工漲超2%,中國石油股份漲超2%,中海油田服務漲超1%。
恆生科技指數成分股方面,截至10:32,中芯國際漲超3%,京東健康漲超2%,華虹半導體漲超2%,中興通訊漲超2%,京東集團漲超1%,小米小幅上漲近1%;祖龍娛樂大跌超6%。美團大跌超6%,業績顯示Q4營收同比增長34.7%,經調整淨虧損14.4億元,並且在未來幾個季度可能繼續錄得運營虧損。快手跌超3%,微盟集團跌超2%,阿裏健康跌超1%。
光伏新能源板塊普遍走弱,截至10:32,保利協鑫能源大跌超5%,新特能源跌超4%,協鑫新能源跌超3%,信義光能跌超3%,福萊特玻璃逆市漲超3%。
在線教育股下行,截至10:32,思考樂跌超8%,新東方跌幅縮窄至0.12%。網傳關於“0-6歲在線教育產品將被禁止”的一份文件,教育部有關負責人表示,規範校外培訓及減輕學生過重課外負擔是常態工作。
個股方面,截至10:32,恆大汽車跌超10%,遭新華社點名“紙上造車”。嗶哩嗶哩港股上市首日破發,現跌超2%,發行價808港元/股。泡泡瑪特大漲超10%,2020年營收同比增長49.3%,年售潮玩超5000萬隻。
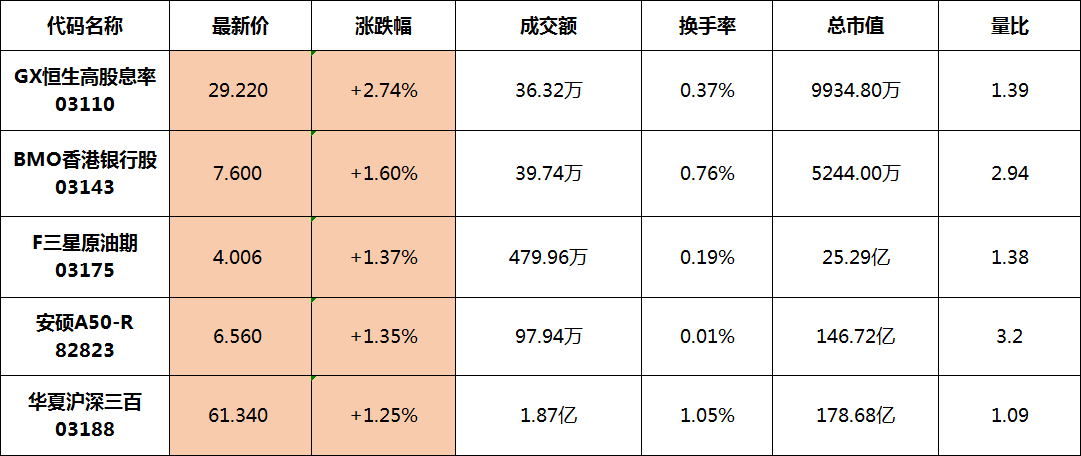
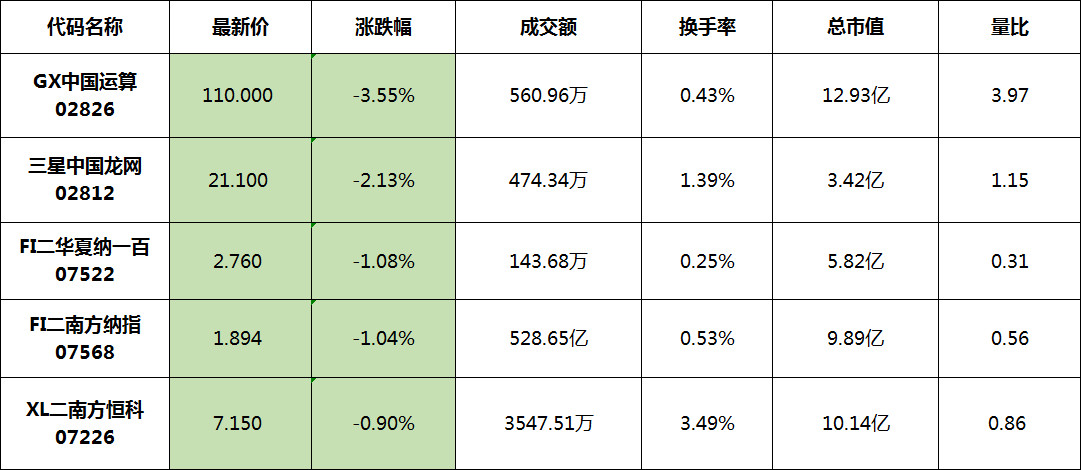
交易活躍的港股ETF方面,截至11:18,GX恆生高股息率(03110)領漲榜單,漲2.74%。BMO香港銀行股(03143)緊隨其後,漲1.60%,量比2.94。另一方面,GX中國運算(02826)領跌榜單,跌3.55%,量比3.97,總市值仍保持12.93億。三星中國龍網(02812)跌2.13%。
漲幅榜前五:
跌幅榜前五:
Follow us
Find us on
Facebook,
Twitter ,
Instagram, and
YouTube or frequent updates on all things investing.Have a financial topic you would like to discuss? Head over to the
uSMART Community to share your thoughts and insights about the market! Click the picture below to download and explore uSMART app!

Disclaimers
uSmart Securities Limited (“uSmart”) is based on its internal research and public third party information in preparation of this article. Although uSmart uses its best endeavours to ensure the content of this article is accurate, uSmart does not guarantee the accuracy, timeliness or completeness of the information of this article and is not responsible for any views/opinions/comments in this article. Opinions, forecasts and estimations reflect uSmart’s assessment as of the date of this article and are subject to change. uSmart has no obligation to notify you or anyone of any such changes. You must make independent analysis and judgment on any matters involved in this article. uSmart and any directors, officers, employees or agents of uSmart will not be liable for any loss or damage suffered by any person in reliance on any representation or omission in the content of this article. The content of the article is for reference only and does not constitute any offer, solicitation, recommendation, opinion or guarantee of any securities, virtual assets, financial products or instruments. Regulatory authorities may restrict the trading of virtual asset-related ETFs to only investors who meet specified requirements. Any calculations or images in the article are for illustrative purposes only.
Investment involves risks and the value and income from securities may rise or fall. Past performance is not indicative of future performance. Please carefully consider your personal risk tolerance, and consult independent professional advice if necessary.


