單季股價暴跌逾四成 ,這隻“閃崩股”的砸盤主力究竟是誰?
本文來自上海證券報,作者:吳正懿
一年一度的年報“成績單”,使“潛伏者”顯山露水,讓“撤離者”暴露蹤跡。
從2020年9月30日的39元,到2020年12月31日的22.9元,一個季度股價暴跌逾四成的京基智農所留下的股價K線圖,至今仍讓投資者心驚膽寒。
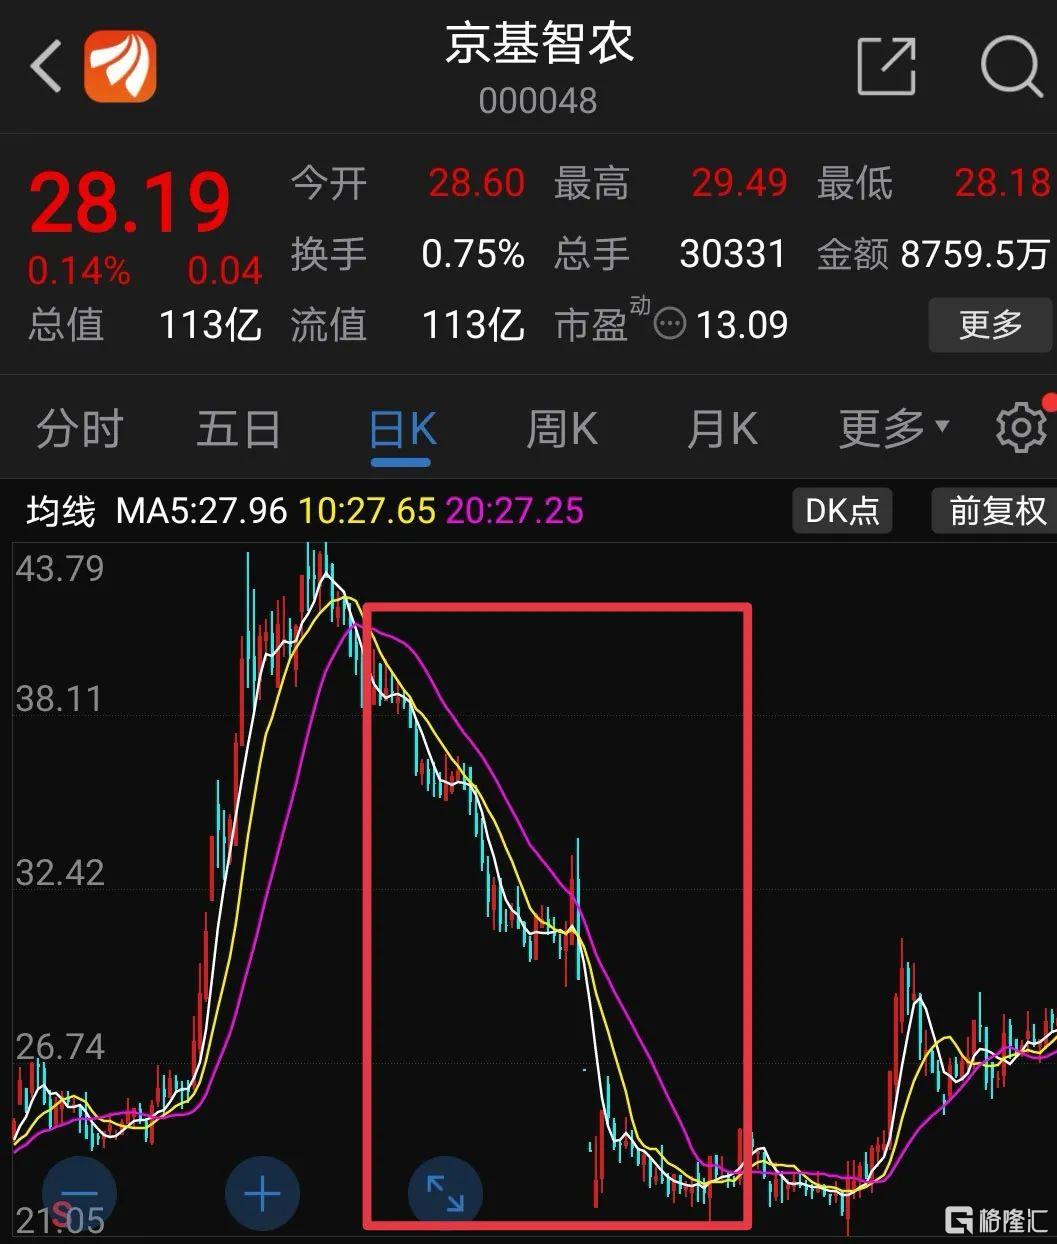
2020年9月30日至2020年12月31日京基智農股價K線圖
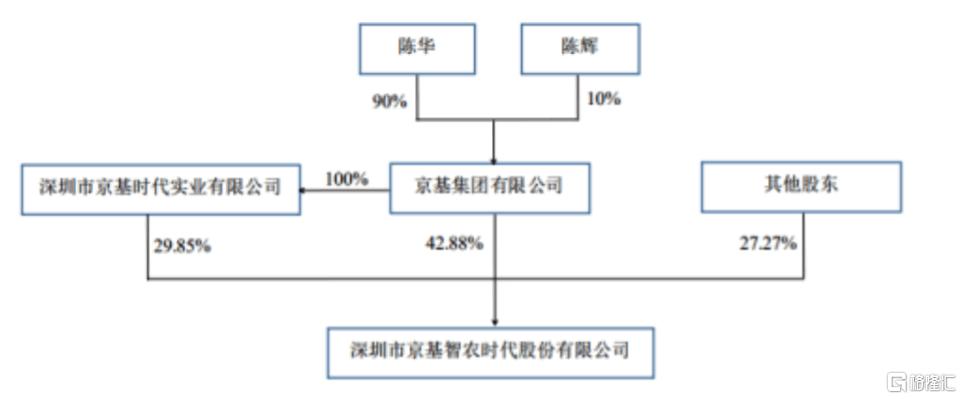
究竟是誰在砸盤?透過京基智農今年3月26日發佈的年報,“大賣家”的蹤跡找到了。
年報顯示,京基智農2020年實現營業收入40.72億元,同比下降17.22%;歸母淨利潤8.67億元,同比下降21.28%。與平淡的財務指標相比,更引人關注的是公司股東榜的變化。比照2020年三季報,京基智農四季度閃現了“天倚道天道10號私募證券投資基金”等四張新面孔,與之對應的則是四名自然人股東退出榜單。
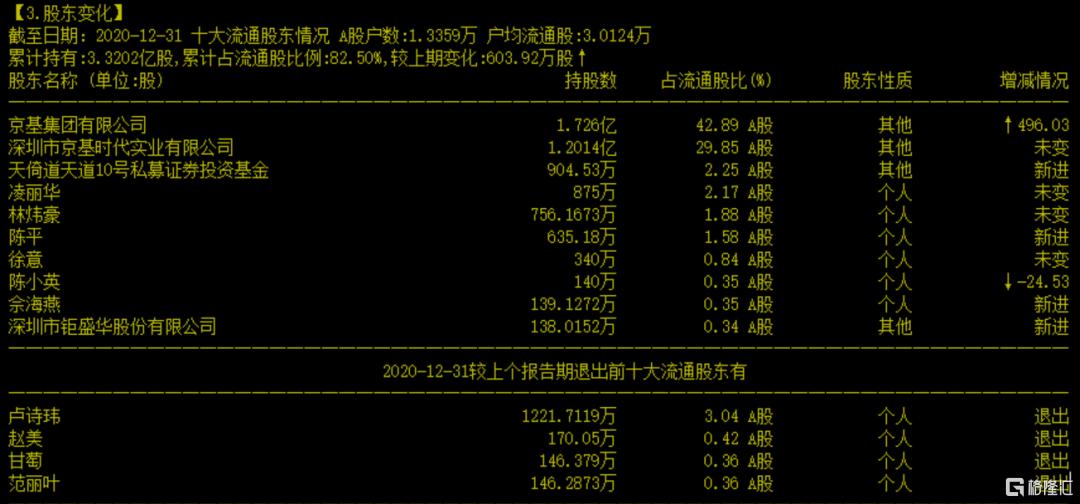
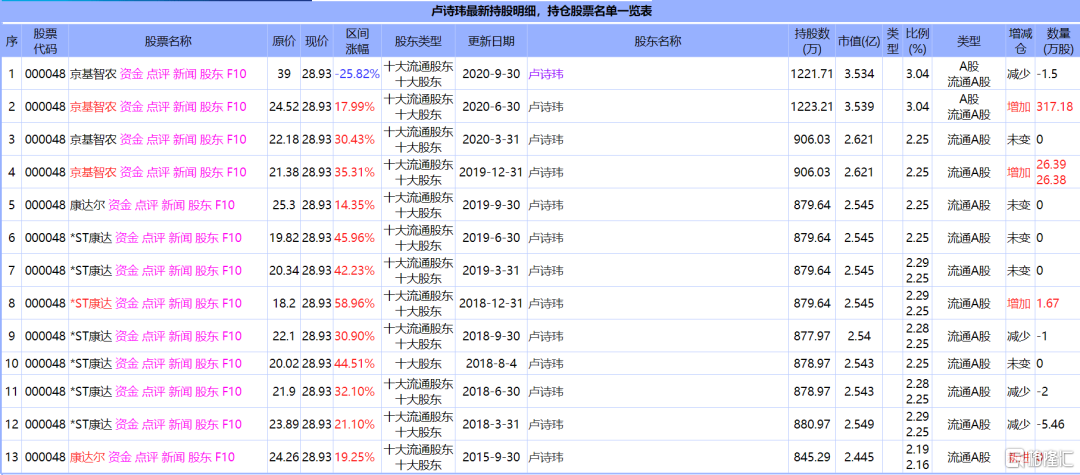
撤離的四名股東分別為盧詩瑋、趙美、甘萄和範麗葉,其中盧詩瑋截至2020年三季度末的持股比例高達1221.71萬股,佔總股本的3.04%,但年報中其已不見蹤跡。
查詢可見,盧詩瑋在資本市場並沒有其他投資記錄,但卻是京基智農的“擁躉”,其在2015年三季報中第一次現身時,京基智農的股票簡稱還是“康達爾”,盧詩瑋持股數量達845.29萬股,佔總股本的2.16%。之後,因持股數被其他股東趕超隱匿“水下”,2018年一季報則重新冒頭亮相,持股數變成了880.97萬股。2020年第二季度,盧詩瑋加倉317萬股,持股數增至1223.21萬股,截至2020年三季度末持股數為1221.71萬股。
從未顯山露水的盧詩瑋,為何堅守京基智農五年多?答案無從知曉。但耐人尋味的是,康達爾在變身為京基智農的過程中,經歷了一場曠日持久的控股權爭奪戰。
2013年,通過不斷舉牌增持,京基集團陣營逐漸成為康達爾第二大股東,與第一大股東華超集團的持股差距不足1%。雙方展開了股權爭奪戰,期間經歷了兩大股東互相起訴、監管問詢、罷免管理層、撤換董事會等一系列“宮鬥”劇情,康達爾也因延遲發佈年報被“披星戴帽”。
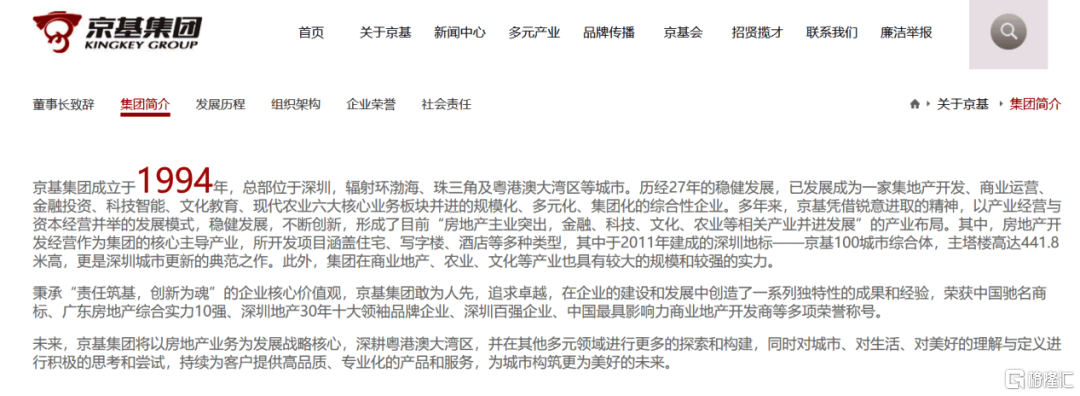
後來,隨着康達爾原董事長、華超集團董事長羅愛華被刑拘,京基集團在2018年11月拿下控制權,成為第一大股東。之後,京基集團通過收購華超集團、發起要約收購、二級市場增持等方式,最新持股比例升至72.73%。據測算,京基集團在這場控股權爭鬥中耗資至少在50億元以上。
在如此激烈的博弈中,盧詩瑋多年持股,究竟是財務投資還是陣營同盟,令人浮想聯翩。從投資成本方面看,盧詩瑋2015年潛伏時成本約20元/股,京基智能股價最多逼近46元,多數時間徘徊在20多元,利潤並不算豐厚。
弔詭的是,盧詩瑋2020年二季度加倉後,京基智農股價隨後出現了一波翻倍行情,而後開始了為期3個多月的大幅調整,併發生了連續三日跌停的“閃崩”情形,股價坐了一回“過山車”。閃崩發生後,京基集團於2020年11月底宣佈增持“維穩”,盧詩瑋也在2020年四季度完成了清倉出貨。
以京基智農2020年四季度區間加權股價28元計算,盧詩瑋拋售1223.21萬股的套現金額達3.4億元。
“由於控股股東持股比例非常高,京基智農的實際流通盤很小,盧詩瑋等‘大户’的賣出交易,確實可能對盤面造成很大的影響。不過,盧詩瑋究竟是主動減持還是被動爆倉,不得而知。”市場人士表示。
有意思的是,京基智農2020年年報還透露,京基集團已清倉了另一隻“閃崩股”仁東控股的股份。
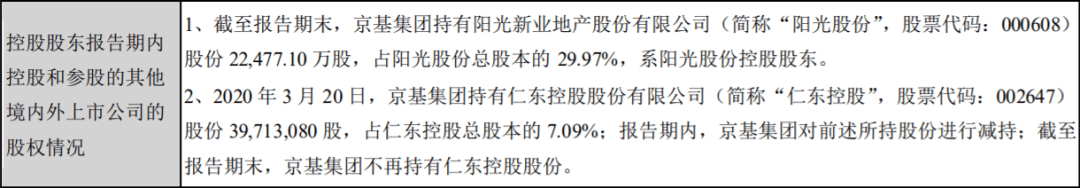
2020年11月25日,仁東控股曾與京基智農同步閃崩,京基智農在連續三個跌停板後才企穩,仁東控股則“一口氣”14個交易日跌停,區間最大跌幅近90%。
以上種種都是巧合麼?
Follow us
Find us on
Facebook,
Twitter ,
Instagram, and
YouTube or frequent updates on all things investing.Have a financial topic you would like to discuss? Head over to the
uSMART Community to share your thoughts and insights about the market! Click the picture below to download and explore uSMART app!

Disclaimers
uSmart Securities Limited (“uSmart”) is based on its internal research and public third party information in preparation of this article. Although uSmart uses its best endeavours to ensure the content of this article is accurate, uSmart does not guarantee the accuracy, timeliness or completeness of the information of this article and is not responsible for any views/opinions/comments in this article. Opinions, forecasts and estimations reflect uSmart’s assessment as of the date of this article and are subject to change. uSmart has no obligation to notify you or anyone of any such changes. You must make independent analysis and judgment on any matters involved in this article. uSmart and any directors, officers, employees or agents of uSmart will not be liable for any loss or damage suffered by any person in reliance on any representation or omission in the content of this article. The content of the article is for reference only and does not constitute any offer, solicitation, recommendation, opinion or guarantee of any securities, virtual assets, financial products or instruments. Regulatory authorities may restrict the trading of virtual asset-related ETFs to only investors who meet specified requirements. Any calculations or images in the article are for illustrative purposes only.
Investment involves risks and the value and income from securities may rise or fall. Past performance is not indicative of future performance. Please carefully consider your personal risk tolerance, and consult independent professional advice if necessary.


