快手(01024.HK)2020全年業績出爐,真的虧了這麼多嗎?
作者:阿日

週二晚間,快手(01024.HK)發佈了2020年全年業績報吿,這是其上市後的第一份成績單。
▲ 2020年,快手總營收為人民幣588億元,同比+50.24%;其中Q4營收180.99億元,同比+52.70%,較Q3的營收增速再提升2個百分點;
▲ 日活躍用户數(DAU)達到2.65億,同比+50.68%;月活躍用户數(MAU)達到4.8億,同比+45.61%;
▲ 用户粘性也有顯著提升,單用户日均使用時長由19年的平均74.6分鐘/日提升到87.3分鐘/日;
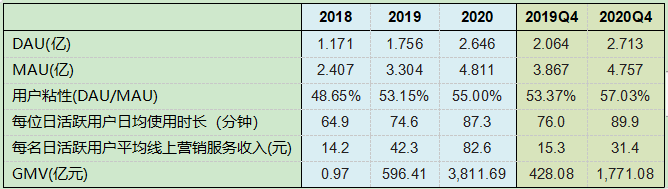
圖:快手經營數據 來源:公司公吿
公司整體毛利率連續兩年提升,由2019年的36%增長至20年的41%,提升4.5個百分點。其中的主要原因是廣吿及電商業務佔比提高,而直播業務中主播分成比例下降,因此使得整體毛利率提升。
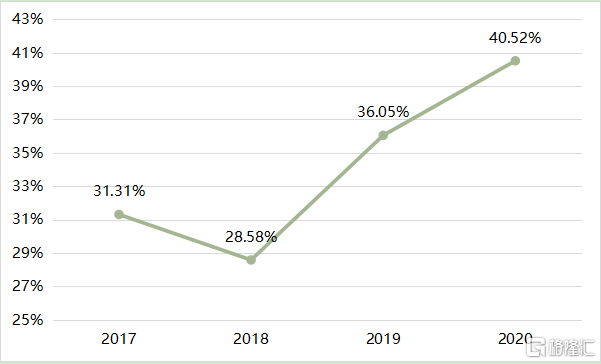
圖:快手毛利率 來源:公司公吿
值得注意的是快手的盈利情況,目前市場已經有很多誤解的聲音。
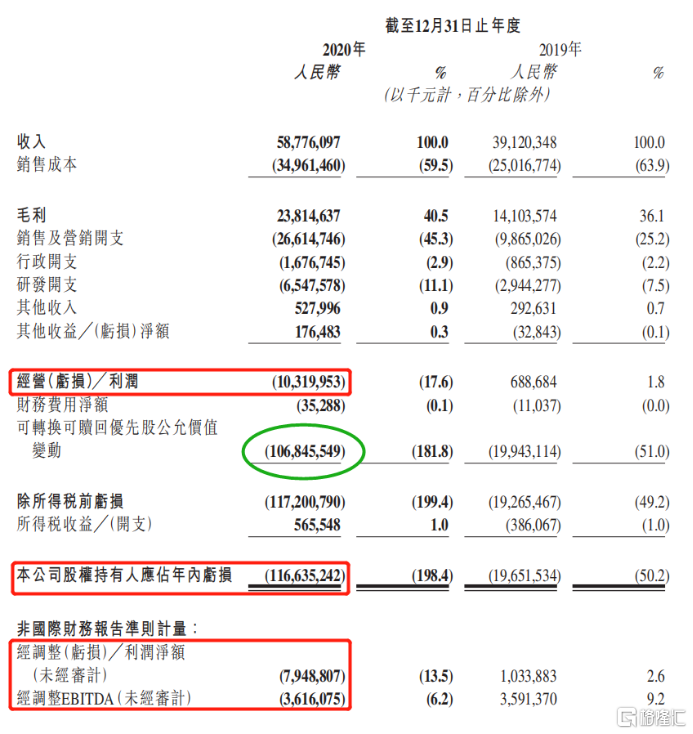
圖:快手財務數據 來源:公司公吿
目前快手尚未盈利,在年報中投資者可以看到虧損相關數據,值得注意的地方分別是:
▲ 經營虧損103.2億;
▲ 股權持有人應占年內虧損1166.4億(即歸母淨利潤);
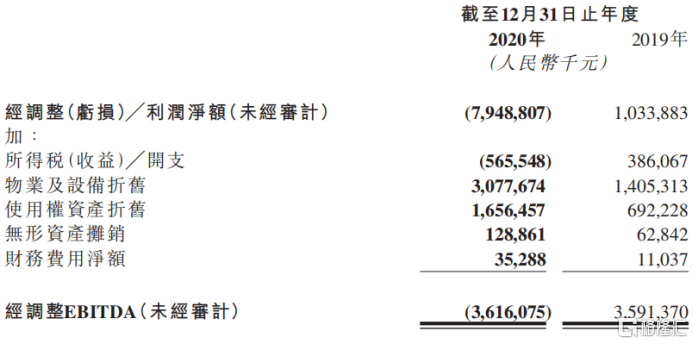
▲ 非國際準側:經調整虧損79.49億;經調整EBITDA 36.16億。
簡單來説,經營虧損=毛利-營銷、行政、研發費用+其他收入/虧損,反映的是公司整體運營情況。
而從經營虧損下一步到歸母淨利潤,顯示虧損從103億變成了1166億,其中影響最大的一項叫做"可轉換可贖回優先股公允價值變動",這一項虧損有1068.5億。
其實這並不罕見,在2017年,小米上市時顯示虧損439億元,然而其經營利潤122億,經營層面並無問題,但也是"可轉換可贖回優先股公允價值變動"為541億,大幅拖累了最終的歸母淨利潤。
"可轉換可贖回優先股公允價值變動"並非主營業務的經營虧損,通常,互聯網公司在多輪融資中會發行可轉換可贖回優先股,在國際準則下,優先股會先體現對股東的負債,其公允價值的上升會記錄於公司賬面的虧損,但實際上公司並未沒有這樣的虧損發生,對公司實際運營也沒有影響。公司價值越大,這項"虧損"值反而越高。之後優先股轉為普通股,這部分虧損就會消失不再計入報表。
而為了使投資者不受這部分因會計準側造成的混淆,經調整虧損則是將這一部分影響加回,使投資者可以瞭解真正的淨利潤情況:
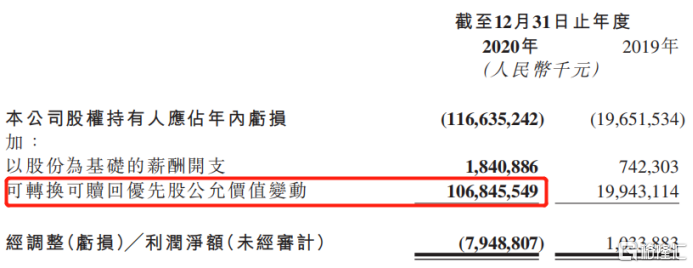
圖:經調整虧損 來源:公司公吿
同樣的,經調整EBITDA則是排除了税息折舊攤銷之後的淨利潤,也是為了使投資者更直觀的瞭解公司真正運營情況,這兩項非國際準則下的淨利潤均是常用指標。
瞭解到快手並非實際虧了1166億之後,我們再來看看分業務表現情況:
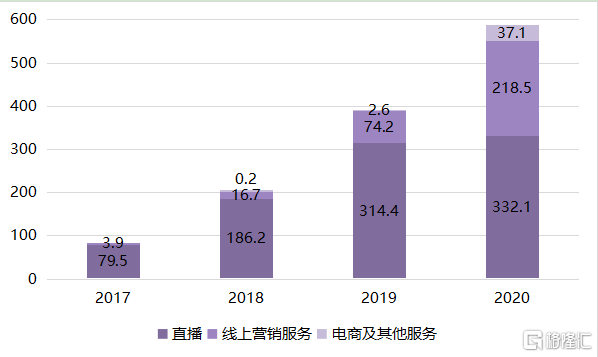
圖:快手分業務營收 來源:公司公吿
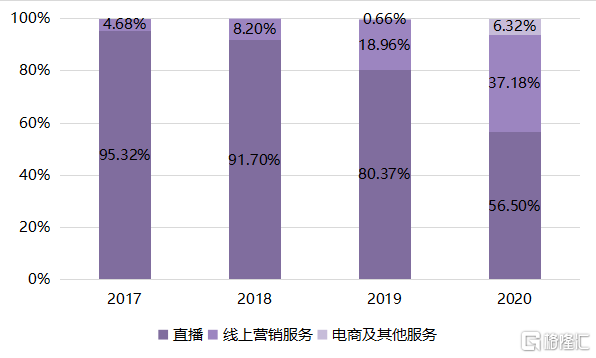
圖:快手分業務營收佔比 來源:公司公吿
分業務來看:
1.直播業務:2020年營收332億元,同比增長5.6%,主要是由於用户羣體擴大導致付費用户人數增加,直播平均每月付費用户由2019年的48.9百萬人增至2020年的57.6百萬人;
2.線上營銷服務:線上營銷服務即廣吿業務,2020年營收219億元,同比增加194.6%;廣吿業務提升十分明顯,業務ARPU由19年的42.3元/人提升到20年82.6元/人,同比+95.3%,主要是由於用户羣體擴大吸引廣吿投放,以及算法的提升;
3.電商及其他業務:電商及其他服務收入由19年的人民幣2.6億元增加超過13.3倍至20年的人民幣37億元,主要是由於電商業務擴展所致。快手GMV從19年的596.41億元增長到20年的3811.7億元,這一塊業務的潛力開始釋放。
整體來看,快手20年營收保持了50%的高增速,毛利率也在繼續提升。從各業務情況來看,廣吿業務營收佔比大幅提升,是20年的最大亮點。
總體來説,快手這第一份財報基本符合市場預期。
Follow us
Find us on
Facebook,
Twitter ,
Instagram, and
YouTube or frequent updates on all things investing.Have a financial topic you would like to discuss? Head over to the
uSMART Community to share your thoughts and insights about the market! Click the picture below to download and explore uSMART app!

Disclaimers
uSmart Securities Limited (“uSmart”) is based on its internal research and public third party information in preparation of this article. Although uSmart uses its best endeavours to ensure the content of this article is accurate, uSmart does not guarantee the accuracy, timeliness or completeness of the information of this article and is not responsible for any views/opinions/comments in this article. Opinions, forecasts and estimations reflect uSmart’s assessment as of the date of this article and are subject to change. uSmart has no obligation to notify you or anyone of any such changes. You must make independent analysis and judgment on any matters involved in this article. uSmart and any directors, officers, employees or agents of uSmart will not be liable for any loss or damage suffered by any person in reliance on any representation or omission in the content of this article. The content of the article is for reference only and does not constitute any offer, solicitation, recommendation, opinion or guarantee of any securities, virtual assets, financial products or instruments. Regulatory authorities may restrict the trading of virtual asset-related ETFs to only investors who meet specified requirements. Any calculations or images in the article are for illustrative purposes only.
Investment involves risks and the value and income from securities may rise or fall. Past performance is not indicative of future performance. Please carefully consider your personal risk tolerance, and consult independent professional advice if necessary.


