【国信策略】A股估值不高,基金重仓股相对估值大概率回归
核心结论
如同行情一样,当前A股估值不是“高不高”的问题,而是“极度分化”的问题:1)A股总体估值水平不高,甚至低于历史平均水平,wind全A、沪深300、中证500、中证1000的市盈率中位数分别为36.3倍、30.9倍、29.2倍、34.2倍,分别处于32%、81%、33%、29%的历史分位数水平(截至2月22日);2)高估值主要体现在基金重仓股的相对估值,市盈率普遍处在历史90%分位数以上,近期市场的调整,实质上是基金重仓股的相对估值有所“均值回归”;3)由于市场总体估值不高,当前位置市场见顶的可能性较小,以往市场见顶往往都会出现“补涨”、“消灭低价股”等特征,从而使得市场整体估值都较高;4)在市场整体不高,且经济复苏盈利周期向上的背景下,我们认为后续行情会出现更多轮动和扩散的机会。
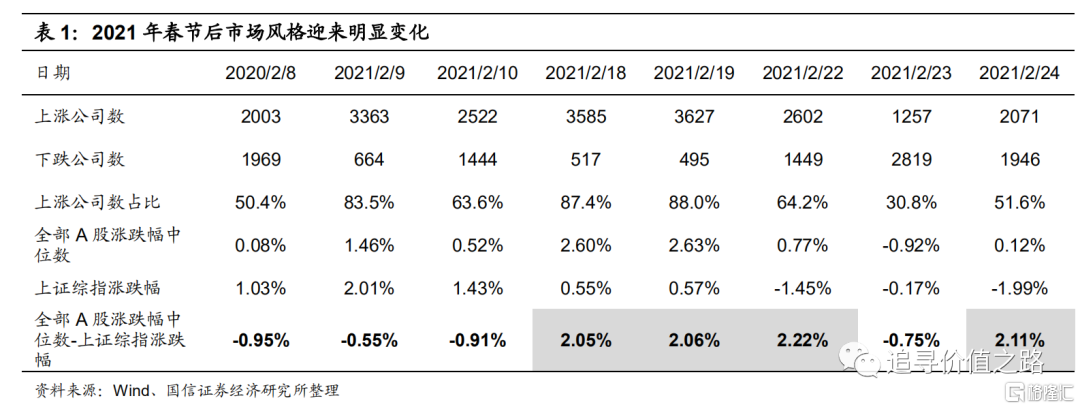
春节期间,我国各项经济数据表现亮眼,同期海外股市普涨,主要大宗商品价格持续提升。A股在春节后的首个交易日迎来高开,上证指数开盘突破3700点。然而在短短一周内,市场风格迎来明显变化,节后A股中位数涨幅开始大幅领先上证指数涨幅。节前热门的食品饮料、医药、新能源等板块在节后连续回调。
当前A股总体估值不算高
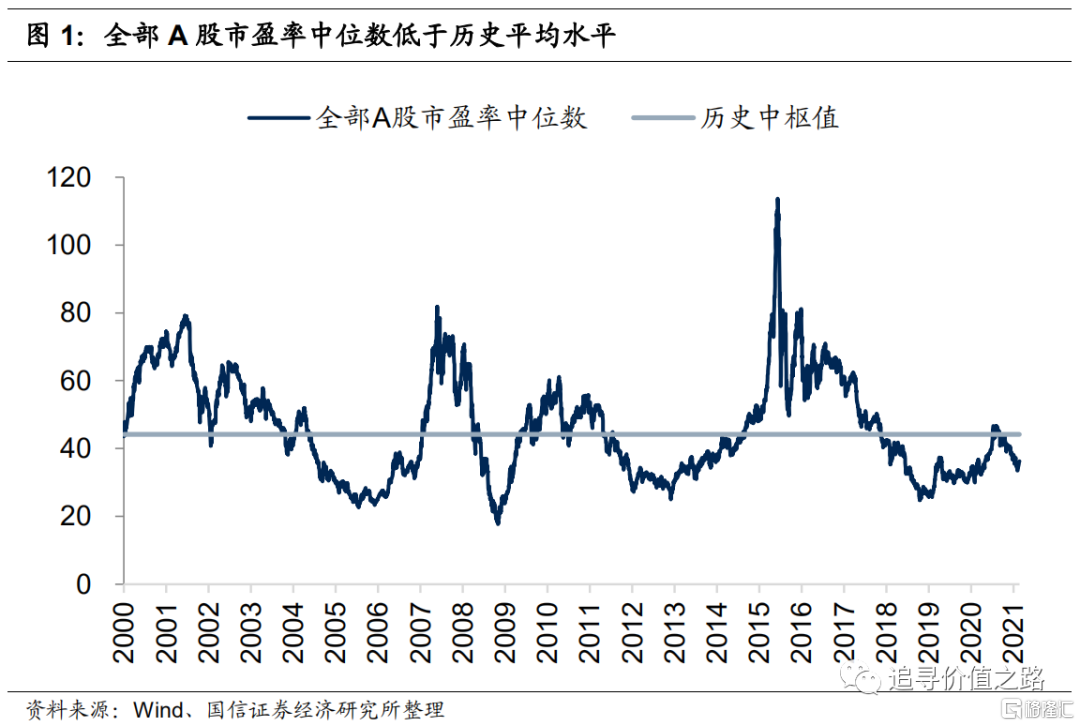
从A股总体估值来看,截至2021年2月22日,全部A股市盈率(TTM)中位数为36.3倍(剔除负值,下同),位于32%的历史分位点,低于44.2倍的历史中枢值。当前A股总体估值水平不算高,甚至是低于历史平均水平的。
基金重仓股估值偏高
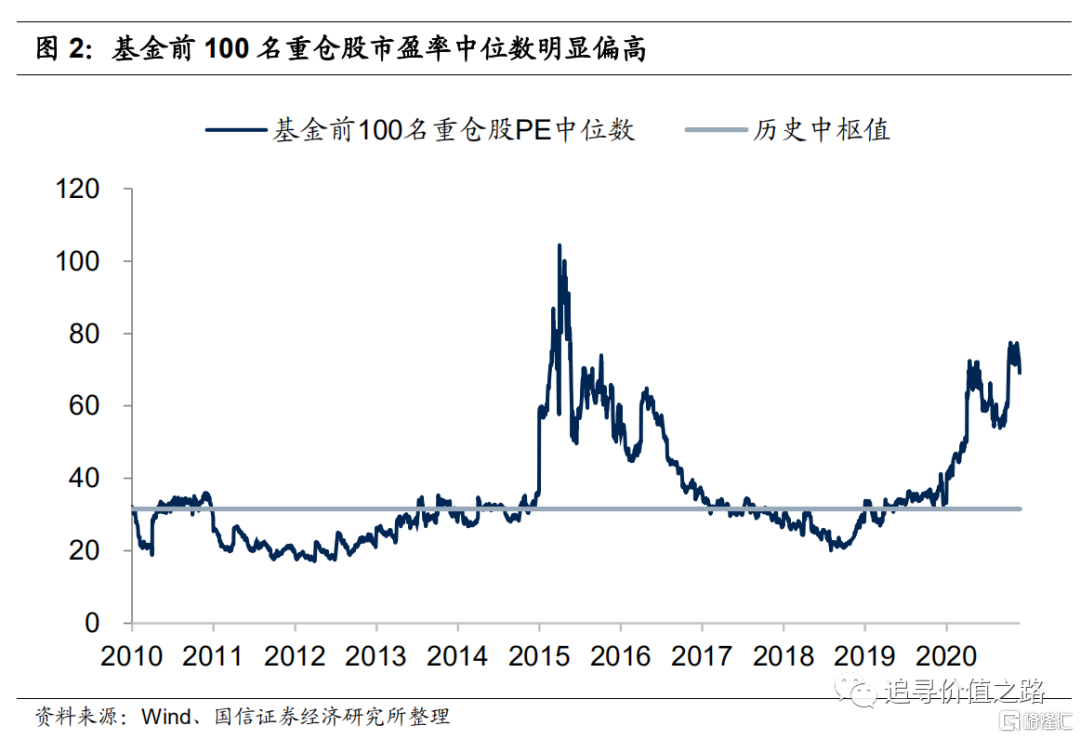
虽然A股总体估值不算高,但基金重仓股存在显著的估值偏高现象。通过对公募基金持仓进行分析可以发现,截至2021年2月22日,基金重仓前100名的股票市盈率中位数已达69.1倍,处在96%的历史分位点附近,基金重仓股的估值明显偏高。基金前200名、前300名、前400名重仓股的市盈率中位数分别为62.6倍、60.2倍、58.2倍,分别处在90.5%、90.6%、90.1%的历史分位数,估值普遍偏高。
沪深300市盈率中位数首次超过中证500
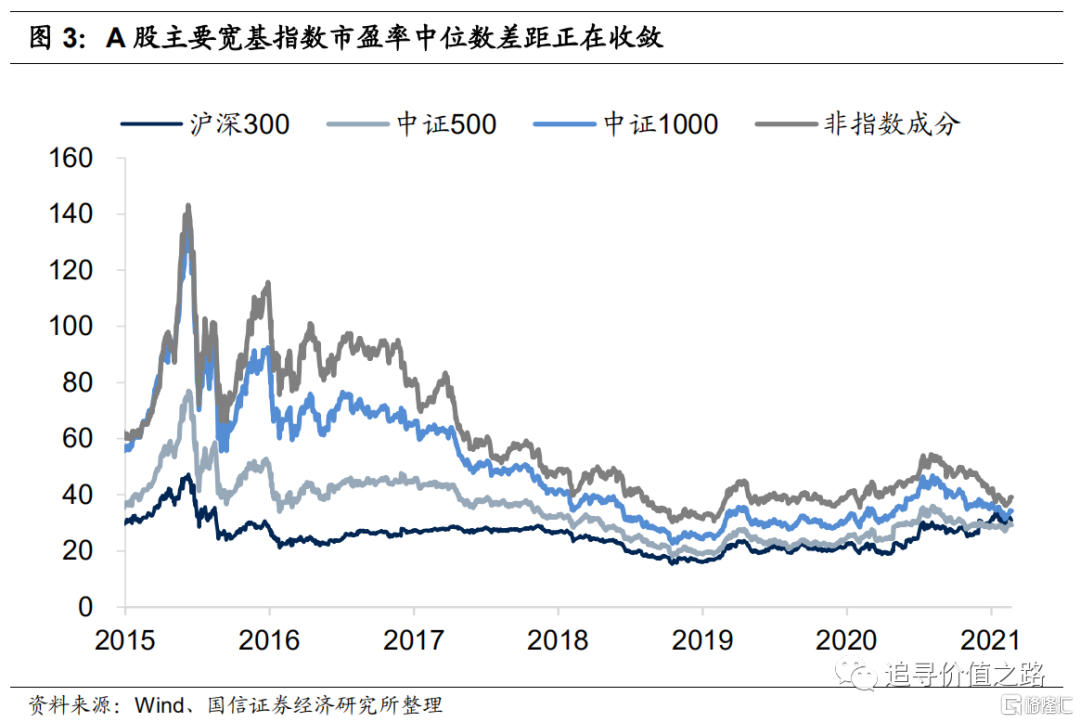
一般而言,A股市场的大盘股、中盘股、小盘股指数市盈率呈递增排列。长期以来,沪深300、中证500、中证1000指数的市盈率中位数也满足该规律。但是自2020年12月以来,沪深300指数市盈率中位数首次超过中证500指数。目前沪深300、中证500、中证1000指数的市盈率中位数分别为30.9、29.2、34.2,分别处于81%、33%、29%的历史分位数。这从另一个角度提示了大盘蓝筹股的相对估值可能已处于高位,而前期关注度较低的中小盘细分龙头股可能具备较好的投资性价比。
基金重仓股相对估值回归可能性较高
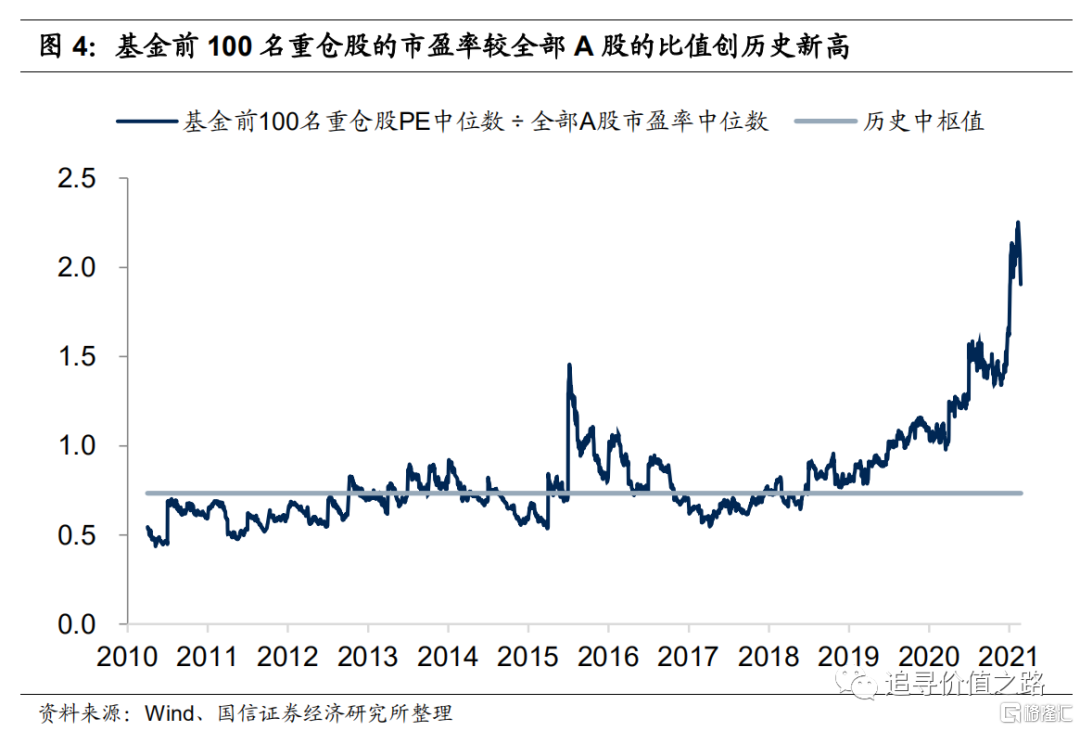
从基金重仓股的相对估值水平来看,基金前100名重仓股的市盈率较全部A股的比值达1.9倍,处在99%的历史分位点位置,远远突破此前历史高点。如果未来行情向“均值回归”演绎,基金重仓股的相对估值有可能率先回调。通常相对估值的调整有两种可能,一种是基金重仓股持续大幅调整,回吐大部分前期涨幅。另一种可能是A股行情发生扩散,引发新一轮补涨或轮涨行情。我们认为在盈利复苏强劲、流动性没有出现大幅收紧的背景下,往后发生补涨或轮涨的可能性更大一些。
综上,我们认为当前A股总体估值水平不高,甚至低于历史平均水平。目前基金重仓股估值偏高,普遍处在历史90%分位数以上。超级蓝筹股的相对估值已处于高位,而部分细分龙头股票或已具备较好的投资性价比。我们认为在经济复苏盈利周期向上的背景下,后续行情会出现更多轮动和扩散的机会。
风险提示:宏观经济不及预期、海外市场大幅波动、历史经验不代表未来。
Follow us
Find us on
Facebook,
Twitter ,
Instagram, and
YouTube or frequent updates on all things investing.Have a financial topic you would like to discuss? Head over to the
uSMART Community to share your thoughts and insights about the market! Click the picture below to download and explore uSMART app!

Disclaimers
uSmart Securities Limited (“uSmart”) is based on its internal research and public third party information in preparation of this article. Although uSmart uses its best endeavours to ensure the content of this article is accurate, uSmart does not guarantee the accuracy, timeliness or completeness of the information of this article and is not responsible for any views/opinions/comments in this article. Opinions, forecasts and estimations reflect uSmart’s assessment as of the date of this article and are subject to change. uSmart has no obligation to notify you or anyone of any such changes. You must make independent analysis and judgment on any matters involved in this article. uSmart and any directors, officers, employees or agents of uSmart will not be liable for any loss or damage suffered by any person in reliance on any representation or omission in the content of this article. The content of the article is for reference only and does not constitute any offer, solicitation, recommendation, opinion or guarantee of any securities, virtual assets, financial products or instruments. Regulatory authorities may restrict the trading of virtual asset-related ETFs to only investors who meet specified requirements. Any calculations or images in the article are for illustrative purposes only.
Investment involves risks and the value and income from securities may rise or fall. Past performance is not indicative of future performance. Please carefully consider your personal risk tolerance, and consult independent professional advice if necessary.


