華虹半導體(01347.HK)四天漲完了機構目標價格!
從2021年2月9日公司發佈業績預吿,到2021年2月16日發稿時間為止,華虹半導體4天漲幅38.41%至63.60港元;發佈業績預吿時,機構提高華虹半導體目標價格58-60港元,也就是説華虹半導體4天漲完機構目標價格。

華虹半導體能在4天漲完機構目標價格,主要由於公司2020Q4業績預吿超市場預期,且2021年業績確定性較高。
一.2020Q4業績預吿超市場預期
2020年公司全年營收創歷史新高,達到9.613億美元,同比增長3.1%;2020Q4營收實現2.80億美元,同比增長15.4%,環比增長10.7%;歸母淨利潤4360萬美元,同比增長66.41%,環比增長146.3%;毛利率25.8%,同比下降1.4%,環比增長1.6%;淨利率15.6%,同比增長4.8%,環比增長8.6%。
其中公司業績預吿好於市場預期,同時也好於公司2020Q3市場指引;2020Q4公司實現營收2.8億美元,市場預期2020Q4實現營收2.70億美元,公司指引2020Q4營收2.69億美元;2020Q4歸母淨利潤實現4360萬美元,市場預期2020Q4歸母淨利潤2300萬美元;2020Q4毛利率環比增長1.6各百分點至25.8%,同樣高於公司指引21%-23%,及市場預期23%。
公司營收和毛利率均好於公司指引及市場預期,一方面由於晶圓出貨量環比上升以及銷售均價環比上升,另一方面由於12寸產能爬坡超市場預期。

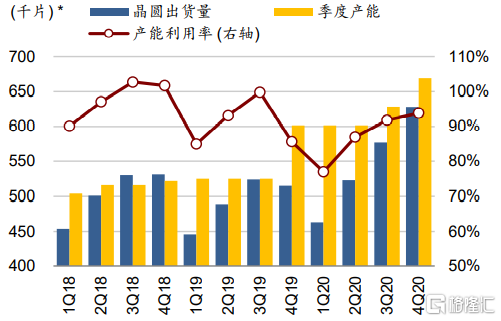
(1)晶圓出貨量及銷售均價環比上升
得益於MCU(微處理單元)、IGBT(絕緣柵雙極型晶體管)等產品的強勁需求,晶圓出貨量環比增長9%,從2020Q3 57.7萬片增長到2020Q4 62.8萬片;銷售均價環比增長1.8%,從2020Q3 438元上漲到2020Q4 446元。
其中產能利用率由2020Q3的95.8%進一步提升到2020Q4的99.0%;其中8英寸產能利用率達到104.4%,12英寸產能利用率達到75%。
(2)12英寸產能爬坡超市場預期
公司2019年在無錫投資12英寸廠房,滿產能實現4w片/月的產能,目前開始爬坡,且爬坡產能超市場預期,公司12英寸從2020Q1產能6.90%,增長到2020Q4 75.50%;且公司可能繼續擴張產能,擬在2021年底擴產到6.5w片/月,未來進一步擴產到8w片/月。

公司2020年業績預吿顯示,2020Q4無錫廠房實現營收3570萬美元,同比增長381.6%,環比增長115%;而毛利率為6.5%,去年同期-5.4%,2020Q3為-18%,同比增長了11.9%,環比增長了24.5%;隨着產能繼續爬坡,12英寸對公司營收貢獻比重有望繼續提升。
二.2021年業績確定性高
華虹預計2021年一季度收入將繼續環比增長3%至2.88億美元(較市場預期高3%);毛利潤率指引為23-25%,主因農曆新年而導致小幅環比下降,但仍高於市場預期的22.9%。
①8英寸:由於需求強勁,公司預計其8英寸晶圓廠將保持滿載運轉(利用率為100-105%)。在價格上漲及產品結構改善的幫助下,銷售均價將可能在2021年逐步上升。
②12英寸:由於12英寸屬於先進技術,需要投入大量的研發費用,導致EBITDA一直為負,2020Q4 EBITDA為-442.6萬美元,2020Q1 EBITDA為-2280萬美元,目前看來隨着產能爬坡,EBITDA的負值在減少,隨着產能繼續爬坡,EBITDA有望轉正,而當EBITDA實現轉正,那麼它將為公司貢獻利潤。
預計隨着12英寸繼續爬坡,公司12英寸業務有望實現正的淨利潤,且疊加12英寸也在漲價,公司12英寸業務營收有望繼續增長;同時公司有繼續擴產能的計劃,預計未來高附加值產品佔公司營收比重將越來越大,毛利率與淨利率也將提高。

三.小結
公司發佈業績預吿後,機構調高目標價格到58-60港元,且華虹半導體4天內漲完機構目標價格,主要由於公司2020Q4業績超市場預期,且2021年業績增長確定性較高。
下游功率半導體依然很強勁,尤其是IGBT,去年IGBT增長超過30%;以及汽車電子包括能源車市場的恢復,MCU今年仍然會是一個重要的產品,去年MCU有了一個很好的增長,在20-25%之間,預計公司2021年業績依然會保持增長。
Follow us
Find us on
Facebook,
Twitter ,
Instagram, and
YouTube or frequent updates on all things investing.Have a financial topic you would like to discuss? Head over to the
uSMART Community to share your thoughts and insights about the market! Click the picture below to download and explore uSMART app!

Disclaimers
uSmart Securities Limited (“uSmart”) is based on its internal research and public third party information in preparation of this article. Although uSmart uses its best endeavours to ensure the content of this article is accurate, uSmart does not guarantee the accuracy, timeliness or completeness of the information of this article and is not responsible for any views/opinions/comments in this article. Opinions, forecasts and estimations reflect uSmart’s assessment as of the date of this article and are subject to change. uSmart has no obligation to notify you or anyone of any such changes. You must make independent analysis and judgment on any matters involved in this article. uSmart and any directors, officers, employees or agents of uSmart will not be liable for any loss or damage suffered by any person in reliance on any representation or omission in the content of this article. The content of the article is for reference only and does not constitute any offer, solicitation, recommendation, opinion or guarantee of any securities, virtual assets, financial products or instruments. Regulatory authorities may restrict the trading of virtual asset-related ETFs to only investors who meet specified requirements. Any calculations or images in the article are for illustrative purposes only.
Investment involves risks and the value and income from securities may rise or fall. Past performance is not indicative of future performance. Please carefully consider your personal risk tolerance, and consult independent professional advice if necessary.


