重挫逾7%!南水依舊兇猛,港交所還舞得動嗎?
繼昨日大漲8%後,港交所今日大幅回調,全天低開低走,截至收盤跌超7%,創下2020年3月以來最大跌幅,成為今日表現最差恆指成份股。股價現報513港元,成交額近99億港元,最新總市值6504億港元。
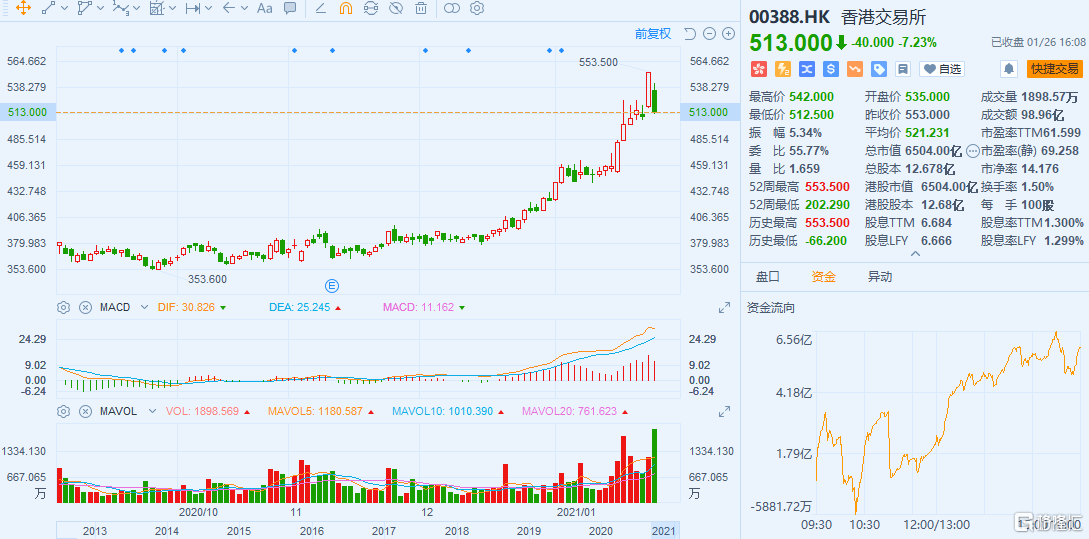
1月25日,港交所股價一度漲至546港元,創下歷史新高,市值超過6900億港元,直奔7千億港元大關而去,堪稱大象起舞。並且,截至昨日為止,該股月內累計漲幅超過30%。漲勢如此兇猛,為何今天突然大跌?
港交所先跌後漲的邏輯,其實跟騰訊控股是十分相似的。我們先來分析它為什麼大漲。
今日,南下資金淨買入港股139.5億港元,已連續25個交易日呈淨買入狀態。近17個交易日中,有16天淨買入突破百億。年內17個交易日內,南下資金共計淨買入港股2644億港元。
出現這一現象的原因在於,部分滬港深基金認為,目前港股性價比較高,隨着新興產業公司到港交所上市,以及中概股大量回歸港股,港股吸引力在不斷增強,部分基金經理去年四季度已加大了港股資產的配比。
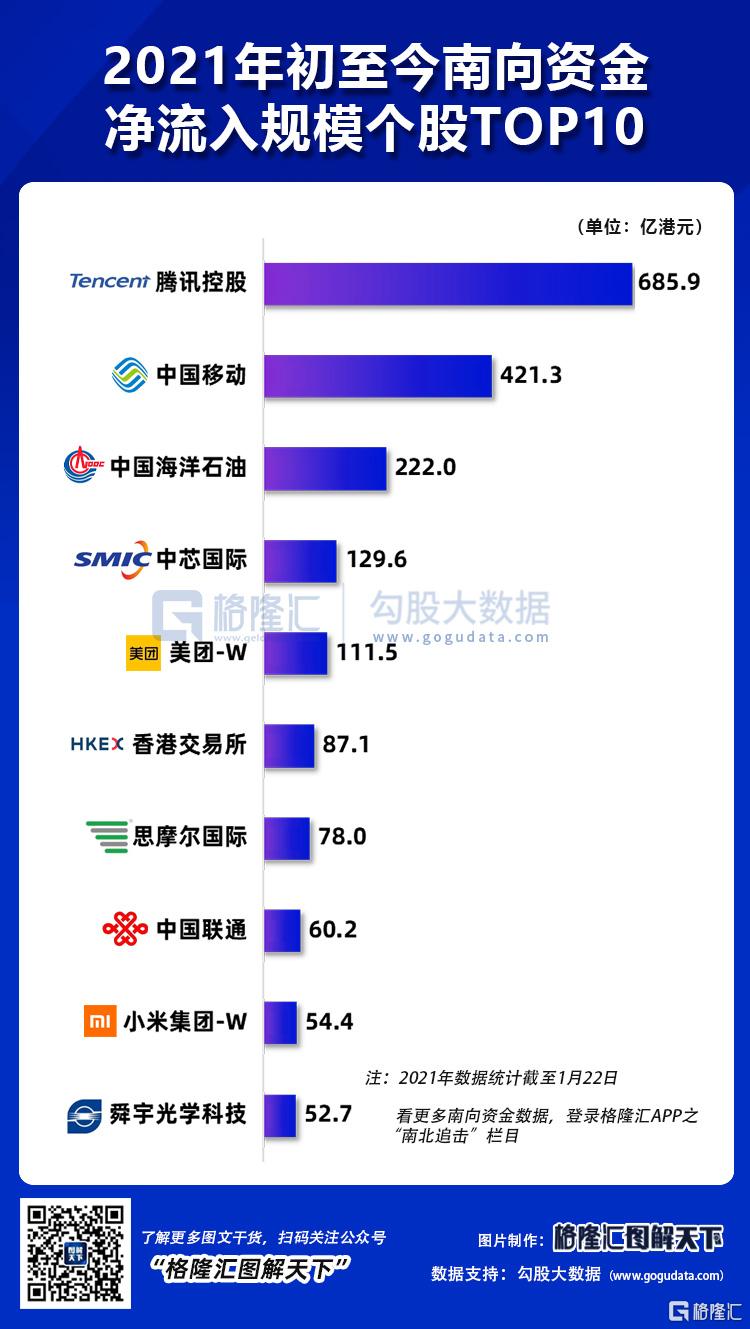
一方面,港交所作為港股最重磅的藍籌股之一,自然吸引了大量南下資金買入。數據顯示,截至上週,港交所位列2021年南向資金淨流入規模個股TOP6;
另一方面,南下資金的瘋狂湧入,使得港股牛市預期的樂觀程度不斷提升;此外,中概股回港上市潮繼續,快手等新經濟的上市也在超預期落地。
多重因素疊加刺激下,港交所股價因而水漲船高。而今日港交所出現回調的原因,則與機構資金出現分歧有關。
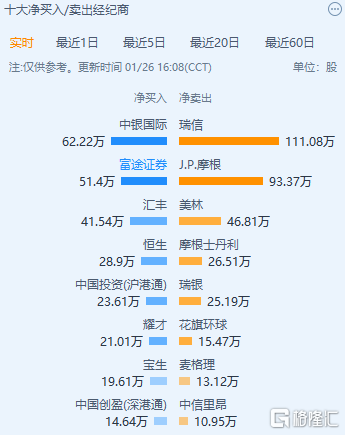
在港交所經歷了一輪16個交易日超過30%的暴漲後,一部分跟風資金快速獲利回吐。從盤口來看,這部分賣出資金多為外資機構。並且不只是港交所,今日大跌的騰訊、美團都出現了相似的現象。
然而,無論是南向資金的瘋狂湧入和港股科技股的暴漲引起外資恐慌從而出逃,還是在一輪猛漲後獲利回吐。外資的撤離雖然會引起港交所在內的藍籌股出現短期回調。但長期來看,港交所本輪上漲的底層邏輯並未發生明顯的變化。
從業績層面看,港交所的營收結構中,來源於與客户投資需求相關的收入佔比超9成。而其營業成本主要是比較剛性的職工薪酬、設備保養和樓宇支出等固定成本。因此,港交所的利潤彈性與香港市場交投活躍度相關性較強。
當前,隨着中資企業赴美上市難度增加,百度、嗶哩嗶哩等中概股正加速回歸;另一方面,快手、抖音等新經濟上市超預期落地;再疊加A股經歷2020年的輪番爆炒後,估值溢價已處於歷史高位,多重因素疊加作用下,導致港股對內資的吸引力仍舊高企。
從業績報表來看,2020年,港交所業績已經受益於以上因素,前三季度85.8億港元的淨利潤,同比2019年有15.76%的提升。
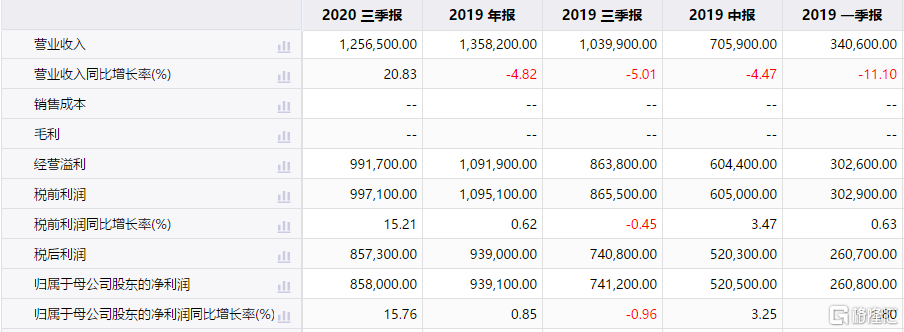
數據來源:IFinD
今日,南向資金依舊延續了2021年以來大幅流入的趨勢,也在一定程度上説明港交所的趨勢性行情將繼續保持。
而隨着交易金額的提升,港交所邊際成本遞減優勢會進一步體現。因此,國泰君安預計,受益於港股交投活躍度的提升,預測20-22年港交所營業收入分別為198.7/262.4/283.6億港元,同比+21.8% /32%/8.1%,利潤分別為121/170.8/184.9億港元,同比+28.9%/41.2%/8.2%。
中金則發表研報稱,港交所有望在2020-2025年實現約20%的盈利年均複合增長,港股日均成交額中樞將到3000億元。以上兩家證券分別上調了港交所的目標價至和598.7港元和634港元。
所以,總結來説,雖然港交所今日出現了一定回調,但長遠來看,和騰訊等個股一樣,短期的回調並不影響其未來一段時間內的上漲邏輯。
Follow us
Find us on
Facebook,
Twitter ,
Instagram, and
YouTube or frequent updates on all things investing.Have a financial topic you would like to discuss? Head over to the
uSMART Community to share your thoughts and insights about the market! Click the picture below to download and explore uSMART app!

Disclaimers
uSmart Securities Limited (“uSmart”) is based on its internal research and public third party information in preparation of this article. Although uSmart uses its best endeavours to ensure the content of this article is accurate, uSmart does not guarantee the accuracy, timeliness or completeness of the information of this article and is not responsible for any views/opinions/comments in this article. Opinions, forecasts and estimations reflect uSmart’s assessment as of the date of this article and are subject to change. uSmart has no obligation to notify you or anyone of any such changes. You must make independent analysis and judgment on any matters involved in this article. uSmart and any directors, officers, employees or agents of uSmart will not be liable for any loss or damage suffered by any person in reliance on any representation or omission in the content of this article. The content of the article is for reference only and does not constitute any offer, solicitation, recommendation, opinion or guarantee of any securities, virtual assets, financial products or instruments. Regulatory authorities may restrict the trading of virtual asset-related ETFs to only investors who meet specified requirements. Any calculations or images in the article are for illustrative purposes only.
Investment involves risks and the value and income from securities may rise or fall. Past performance is not indicative of future performance. Please carefully consider your personal risk tolerance, and consult independent professional advice if necessary.


