7日暴漲1.25倍,四環醫藥還能走多遠?
今日,四環醫藥無疑成為港股生物醫藥板塊最受矚目的個股,在整個板塊撲街的背景下,四環醫藥暴漲28%。1月20日,公司股價大漲43%,引起市場關注,短短7個交易日,公司股價飆升1.25倍,總市值直接翻倍,令人瞠目。

(來源:Wind)
眾所周知,醫美概念股近期連續大漲,龍頭股華熙生物和愛美克均創出歷史新高,市值逼近千億關口。與港股過往資金炒作的暴漲暴跌行情相比,四環生物股價暴漲的背後,正是乘上醫美這一“風口”。
01
四環醫藥此前是中國心腦血管處方藥龍頭企業,在國內市場中擁有一定的市場佔有率。
目前,公司心腦血管領域在研藥物有110餘個,並已獲得300餘項新藥發明專利,在研項目主要涵蓋糖尿病、抗腫瘤、抗感染及非酒精性肝炎等多個重點治療領域。2020年上半年,公司實現營收10.54億元,淨利潤1.705億元。

(來源:Choice數據)
2020年10月26日,四環醫藥發佈公吿稱,由公司獨家代理、韓國生物製藥公司Hugel生產的“注射用A型肉毒毒素(Letybo100U,商品名:樂提葆)”於2020年10月21日正式獲國家藥監局批准上市,成為第四個獲准在中國上市的A型肉毒毒素,也是韓國同類產品中的首個。該產品將於年內開始在中國大陸地區銷售。
此外,四環生物表示後續將推出的玻尿酸和童顏針產品,進一步補充其在醫美行業的產品佈局。可以看出,四環生物在醫美賽道的佈局可謂下足功夫。
02
肉毒毒素作為醫美常見用藥之一,對除皺、瘦臉具有良好效果,已被廣泛使用。
2018年中國肉毒素市場規模64.6億元,2008-2018年年複合增長率為15.5%,假設保持該增長率,則2020年我國肉毒素市場規模為86.2億元,2025年則達到177.1億元。
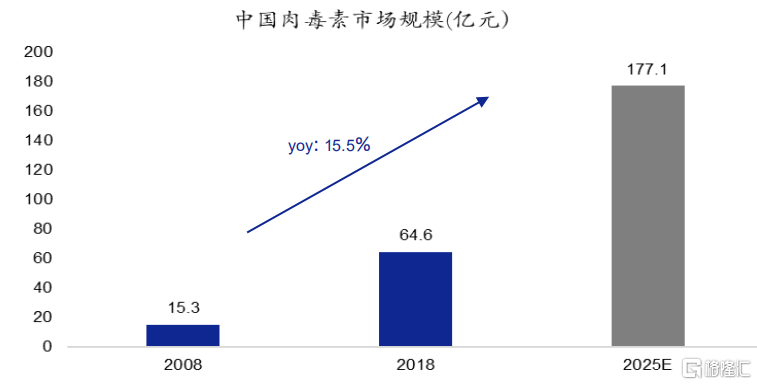
(來源:新思界產業研究中心、安信證券研究中心)
對比美國肉毒毒素市場,中國肉毒素市場規模較小,且水貨假貨佔比較高。美國FDA在2002年即批准肉毒素用作醫美材料之後,行業迅速發展,2019年美國肉毒毒素銷售額達31.4億美元(約合人民幣210.2億元)。此外,據中國整形美容協會提供的數據,國內市場上銷售的玻尿酸和肉毒素類產品70%由假貨和水貨構成,實際年消耗量是正規產品的5倍左右。
保妥適是目前全球肉毒毒素市場份額最高的產品,全球份額曾經高達86%,現在仍有65%以上,除此之外,英國的Dysport和韓國的Neuronox也擁有一定市場份額。
從整個醫美市場來看,注射類醫美項目市場規模行業佔比最大,2019年約57.04%。其中,玻尿酸注射佔比66%,肉毒素注射佔比33%。

(注射類醫美項目佔比,來源:新氧大數據,安信證券研究中心)
玻尿酸作為第一大醫美賽道,市場發展潛力也較大。根據新思界產業研究中心數據,2015年國內美容用玻尿酸市場規模僅為21億元左右,至2019年市場規模增長至58億元,年均複合增速28.9%,以保持該增速測算,則我國美容用玻尿酸市場規模2025年可達343億。
但當前我國醫美市場發展還不夠成熟,產品差異化定位不夠清晰。疊加國家對醫美行業監管趨嚴,中長尾不合規企業加速出清,將利於市場快速進行第一輪整合。
03
目前,國內有華熙生物、愛美客等多個企業與國外肉毒素廠家合作,在國內開展“注射用A型肉毒毒素”臨牀試驗,多個產品已經進行到試驗的第3期階段或已完成臨牀試驗。
由於我國肉毒素審批流程複雜,週期長達8-10年,因此相較於國內潛在競爭對手,四環醫藥預計,國內嚴苛的審批制度將給樂提葆留下3年左右的空窗期。
四環醫藥管理層在1月22日電話會議中透露,預期未來五年中國的肉毒毒素產品銷售將呈爆發式增長,2025年銷售額將達到18億美元,成為與美國及歐盟並駕齊驅的全球三大市場之一,而樂提葆目標是3年內在中國取得超過30%的市場份額。
不過,樂提葆對公司經營狀況能產生多大的影響,目前尚未可知。從二級市場上看,相較於同行業華熙生物、愛美克千億市值,公司總市值不到200億元,仍未體現出作為醫美頭部企業應有表現。但短期內公司股價劇烈波動,振幅十分明顯,中小投資需謹慎。
Follow us
Find us on
Facebook,
Twitter ,
Instagram, and
YouTube or frequent updates on all things investing.Have a financial topic you would like to discuss? Head over to the
uSMART Community to share your thoughts and insights about the market! Click the picture below to download and explore uSMART app!

Disclaimers
uSmart Securities Limited (“uSmart”) is based on its internal research and public third party information in preparation of this article. Although uSmart uses its best endeavours to ensure the content of this article is accurate, uSmart does not guarantee the accuracy, timeliness or completeness of the information of this article and is not responsible for any views/opinions/comments in this article. Opinions, forecasts and estimations reflect uSmart’s assessment as of the date of this article and are subject to change. uSmart has no obligation to notify you or anyone of any such changes. You must make independent analysis and judgment on any matters involved in this article. uSmart and any directors, officers, employees or agents of uSmart will not be liable for any loss or damage suffered by any person in reliance on any representation or omission in the content of this article. The content of the article is for reference only and does not constitute any offer, solicitation, recommendation, opinion or guarantee of any securities, virtual assets, financial products or instruments. Regulatory authorities may restrict the trading of virtual asset-related ETFs to only investors who meet specified requirements. Any calculations or images in the article are for illustrative purposes only.
Investment involves risks and the value and income from securities may rise or fall. Past performance is not indicative of future performance. Please carefully consider your personal risk tolerance, and consult independent professional advice if necessary.


