透視港股通丨內資淨流入93.66億
北水總結
1月22日港股市場,北水淨流入93.66億,終結連續14個交易日淨流入超百億紀錄。其中港股通(滬)淨流入約33.92億港元,港股通(深)淨流入59.74億港元。
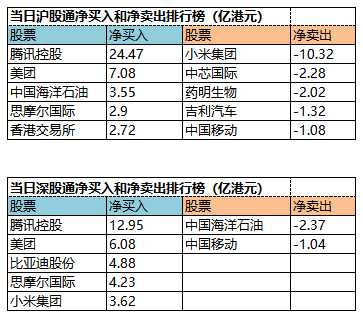
北水淨買入最多的個股是騰訊(00700)、美團-W(03690)、思摩爾國際(06969)。北水淨賣出最多的個股是中國移動(00941)、中芯國際(00981)。

數據來源:盈立智投APP
十大成交活躍股


數據來源:盈立智投APP
個股點評
騰訊(00700)再獲淨買入37.34億港元。消息面上,裏昂發表研究報告,將騰訊目標價由715港元上調14.69%至820港元,鑑於遊戲強勁趨勢的小程序生態系統快速增長,重申“買入”評級,預測遊戲和廣告業務將從預測2022年的20倍市盈率提升至23倍。另有多家大行發研報唱好。麥格理重申騰訊“跑贏大市”評級,目標價846港元;花旗則表示,微信將繼續成爲世界級超級平臺,看高騰訊至734港元;大摩重申騰訊“增持”評級,目標價720港元。
美團-W(03690)獲淨買入13.16億港元。消息面上,富瑞發表研究報告指,重申對美團強大的執行力和其“Food+Platform”戰略價值潛力釋放的正面看法。集團可靠的線下營運能力和技術,應能爲其捕捉線上雜貨店的長期機會鋪平道路。將美團目標價由原來的360港元升至394港元,評級維持“買入”。小摩則指出,美團用戶料將加速增長,團購業務的城市覆蓋擴大及成交總額(GMV)提升,將會是公司業績近期的催化劑,該行上調美團目標價至450港元,評級升至“增持”。
思摩爾國際(06969)獲淨買入7.13億港元。消息面上,思摩爾國際發佈公告稱,於2020財政年度,集團溢利及全面收益總額預期將較去年同期增加約10%至15%。公司還表示,2020財政年度經調整純利預期將同比增加約70%至75%。中金髮布研究報告,上調思摩爾國際2020-22年經調整每股盈利預測3%/5%/3%至0.66/0.93/1.23元人民幣,維持“跑贏行業”評級,目標價上調23%至93.8港元。
比亞迪股份(01211)獲淨買入4.87億港元。消息面上,大和發表研究報告指,比亞迪發行H股將可降低今、明兩年的淨財務費用;而IGBT業務上市計劃正有序推進,同時刀片式電池產能將擴大至75GWH。該行重申其“買入”評級,目標價由250港元上調至290港元。花旗則表示,比亞迪配股集資298億港元,加上去年強勁營運表現錄得65億元人民幣自由現金流,相信比亞迪今年淨債務對股本比率將自去的98%大幅改善至17%,財務成本將按年減少25%至29.2億元人民幣。另外,該行亦預期比亞迪新DMI PHEV型號將推動今年銷售量,提升今年銷售預測,自40.3萬輛上調至41.1萬輛,並上調今年及明年每股盈利預測分別7.5%及1.6%,目標價自339港元上調至349港元,評級維持“買入”。
港交所(00388)獲淨買入2.76億港元。消息面上,花旗表示,受中國公募基金投資驅動,預計今年南向資金淨流入港股的金額將達到3萬億港元,較去年0.7萬億港元的淨流入規模大幅增加。該行上調香港交易所目標價15%至575港元。
保利協鑫能源(03800)獲淨買入9668萬港元,本週累計淨買入額超8.3億港元。消息面上,據硅業分會數據,本週多晶硅市場價格延續上漲走勢,且漲幅環比有所增加。單晶復投料價格區間在8.9-9.2萬元/噸,成交均價9.09萬元/噸,周環比上漲3.53%。在1月份國內多晶硅企業幾乎全部滿產運行、供應大幅增加的情況下,企業比往常提前至少一週開始簽訂下月訂單,可見硅片擴產釋放量刺激的實際需求和下遊爲假期備貨帶來的預需求大幅支撐了國內硅料需求的增長。
此外,中海油(00883)、華潤啤酒(00291)分別獲淨買入1.14億、1811萬港元。而中芯國際(00981)、中國移動(00941)分別遭淨賣出8483萬、2.11億港元。
當日港股通淨買入和淨賣出排行榜
數據來源:盈立智投APP
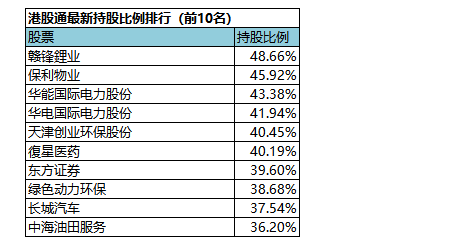
(港股通持股比例排行,交易所數據T+2日結算)
Follow us
Find us on
Facebook,
Twitter ,
Instagram, and
YouTube or frequent updates on all things investing.Have a financial topic you would like to discuss? Head over to the
uSMART Community to share your thoughts and insights about the market! Click the picture below to download and explore uSMART app!

Disclaimers
uSmart Securities Limited (“uSmart”) is based on its internal research and public third party information in preparation of this article. Although uSmart uses its best endeavours to ensure the content of this article is accurate, uSmart does not guarantee the accuracy, timeliness or completeness of the information of this article and is not responsible for any views/opinions/comments in this article. Opinions, forecasts and estimations reflect uSmart’s assessment as of the date of this article and are subject to change. uSmart has no obligation to notify you or anyone of any such changes. You must make independent analysis and judgment on any matters involved in this article. uSmart and any directors, officers, employees or agents of uSmart will not be liable for any loss or damage suffered by any person in reliance on any representation or omission in the content of this article. The content of the article is for reference only and does not constitute any offer, solicitation, recommendation, opinion or guarantee of any securities, virtual assets, financial products or instruments. Regulatory authorities may restrict the trading of virtual asset-related ETFs to only investors who meet specified requirements. Any calculations or images in the article are for illustrative purposes only.
Investment involves risks and the value and income from securities may rise or fall. Past performance is not indicative of future performance. Please carefully consider your personal risk tolerance, and consult independent professional advice if necessary.


