You are browsing the Hong Kong website, Regulated by Hong Kong SFC (CE number: BJA907). Investment is risky and you must be cautious when entering the market.
原奶價格上揚,蒙牛(2319.HK)還可以看好嗎?
格隆匯 01-21 16:26

自2020年下半年以來,原奶價格不往上走,差不多一週一個價,已經超過2014年的高位了。

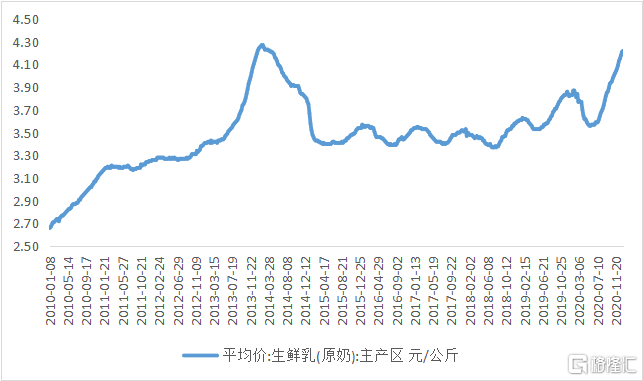
 這種情況下,不免對蒙牛(2319.HK)這種下游企業有所擔憂,畢竟,原奶佔原料成本大頭。但我們經過分析,發現情況可能恰恰相反。

一、行業格局變了

覆盤上一輪原奶價格上漲週期,即2012年-2014年上半年,可以看到,儘管原奶價格上揚,但蒙牛的毛利率卻是上升的。

這與上上輪原奶價格上漲週期完全不同,2003年到2007年這波,這波里蒙牛的毛利率是越打越低。

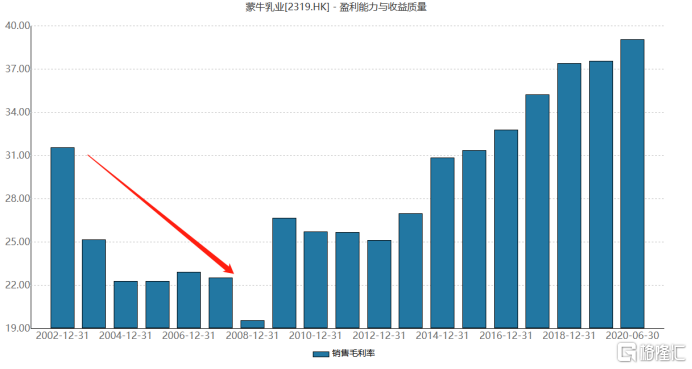
究其原因,是兩波原奶上漲週期中,行業格局不同,2003年到2007年,是行業混戰期,2008年之後行業迎來整合機遇,形成了兩強的格局。

玩家少,就容易達成共識,比如,不打價格戰,默契地一起提價轉移原材料成本上行的壓力。覆盤下來,其手段主要有三個,一是控制費用,二是提價,三是升級產品,也是間接實現單價的提升。

控制費用方面,2010年-2013年,蒙牛的銷售費用沒有提升,2014年才開始出擊,加大銷售費用的支出。伊利的銷售費用率分別是22.95%、19.47%、18.52%、17.89%和18.51%,而其餘年份多是20%以上。可見,龍頭之間有默契,不大搞促銷戰。

再講提價,2013年奶價大漲時期,行業開始普遍提價。蒙牛在當年4月、9月對各類產品提價5%,伊利在4月、9月、12月分別對各類產品提價10%。

除了提價,還有就是結構升級,2011年到2014年期間,蒙牛高端產品的佔比迅速提升。

這些行為之下,雖然原奶價格上漲推高了成本,但蒙牛的毛利率和淨利潤率反而是改善的,利潤的彈性非常明顯。

現在這波新的奶價上行週期裏,行業格局較2012-2014年兩強地位更加穩固,要默契地達成共識更加容易。提價控費,都有利於利潤的改善。

這也是我們看到,為什麼原奶價格步步上行,蒙牛和伊利的股價卻反而走強。


二、長期確定性高

短期原奶價格上行壓力下的行業競爭趨緩,是利好點,長期主要看乳業的天花板。

2014年之前,我國乳製品行業的發展非常快,可謂量價齊升,其中只有2008年因為三聚氰胺事件,導致行業增速回落至6%,之後逐步恢復,2009年到2014年,行業規模年複合增長率達14%。但之後開始放緩,2018年乳類飲品零售規模為2538億,增速不到5%。

所以,整個行業進入成熟期,是事實。

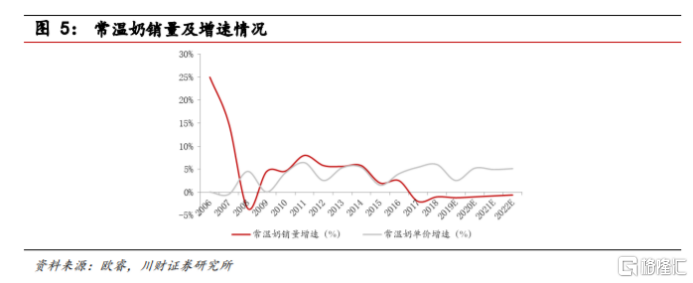
細分來看,巴氏奶、酸奶仍處於發展期,常温奶進入成熟期。

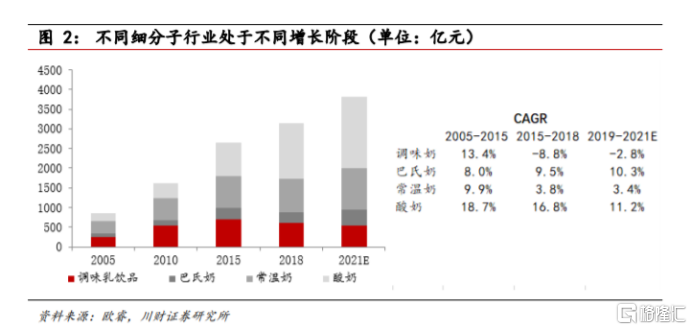
常温奶進入成熟期,並不代表沒有機會,類似啤酒,是量縮而價增的趨勢,雖然不再吆喝,但悶聲發了大財,貢獻利潤還是可觀的。

而其它品類就貢獻新的增長點。雖然對比已經有的巨大存量,這些增長點不具備爆發力,但勝在穩定性與確定性。

從兩個數據看,基本上可以肯定,我國的乳製品這個行業的規模還會繼續擴大。

一是看農村的消費量與城市消費量,可以看到農村的人均水量與城市相比還差一大截,這並不是説未來農村一定要達到城市的水平,但這個差距指出了增長趨勢。隨着農村人均收入的提升以及物流的發達,農村的消費量提升是可以預見的,這會是未來推動乳製品行業增長的重要推動力。

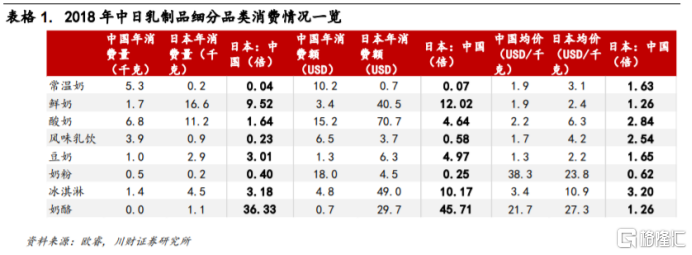
二是跟日本對比。兩國飲食習慣相對來説接近,對比日本,可以看出,我國乳製品行業仍有非常大的增長空間。

所以可以看出,乳製品這個行業只是不具備爆發力地增長了,但繼續增長卻是確定的。

對蒙牛這樣的龍頭企業來説,它的增長除了行業規模擴大外,還來源於市場份額的集中。


三、估值

蒙牛當前的估值是53.5倍,不過,這個數值要調整一下,主要是報表上有一些非經常性損益,調整後蒙牛的估值大概是39倍左右。這個估值不便宜,但在食品飲料龍頭裏,絕對算不上高。

從長期來講,蒙牛的增長是確定的,從短期來講,原奶價格持續上行,行業可能會有提價預期,這反映到報表上就是利潤的彈性非常可觀。

綜合這些來考慮,39倍的蒙牛值得關注,進可攻,退可守。

Follow us
Find us on Facebook, Twitter , Instagram, and YouTube or frequent updates on all things investing.Have a financial topic you would like to discuss? Head over to the uSMART Community to share your thoughts and insights about the market! Click the picture below to download and explore uSMART app!
Disclaimers
uSmart Securities Limited (“uSmart”) is based on its internal research and public third party information in preparation of this article. Although uSmart uses its best endeavours to ensure the content of this article is accurate, uSmart does not guarantee the accuracy, timeliness or completeness of the information of this article and is not responsible for any views/opinions/comments in this article. Opinions, forecasts and estimations reflect uSmart’s assessment as of the date of this article and are subject to change. uSmart has no obligation to notify you or anyone of any such changes. You must make independent analysis and judgment on any matters involved in this article. uSmart and any directors, officers, employees or agents of uSmart will not be liable for any loss or damage suffered by any person in reliance on any representation or omission in the content of this article. The content of the article is for reference only and does not constitute any offer, solicitation, recommendation, opinion or guarantee of any securities, virtual assets, financial products or instruments. Regulatory authorities may restrict the trading of virtual asset-related ETFs to only investors who meet specified requirements. Any calculations or images in the article are for illustrative purposes only.
Investment involves risks and the value and income from securities may rise or fall. Past performance is not indicative of future performance. Please carefully consider your personal risk tolerance, and consult independent professional advice if necessary.
uSMART
Wealth Growth Made Easy
Open Account