首日市值一度突破900億,高瓴押注藍月亮浮盈數十倍
今日,IPO定價13.16港元/股,對應市值約756億港元的“洗衣液一哥”藍月亮,在港股上市了。
在昨日的富途暗盤交易中,藍月亮收報15.98港元,成交額4.02億港元,成為了富途暗盤成交額第二高的新股,僅次於泡泡瑪特的4.73億港元暗盤成交額,超過了農夫山泉的3.56億港元。
藍月亮今日高開16.41%,早盤一度拉昇至24%以上,後回落。截至發稿漲幅約8.8%,報14.32港元,市值約824億港元。
押中藍月亮,高瓴浮盈數十倍
2003年,非典爆發,中國老百姓對於家庭及個人清潔的重視程度達到了空前的高度。以廚房清潔劑起家的藍月亮抓住機會,通過社會捐贈和推廣活動運營成為了國內市場上的洗手液領導品牌。
不過,由於預見了洗手液市場規模有限,2008年,藍月亮又適時的抓住了用洗衣液替代洗衣粉的發展風口,率先開始佈局洗衣液的藍海市場。可以説藍月亮與洗衣液產品實現了相互成就。
2019年,藍月亮70億營收中,衣物清潔護理產品營收佔比為87.6%。
而成為洗衣液品類的破局者,則得以於藍月亮的兩個戰略:積極佈局線上渠道以及冠名衞視節目強化品牌認知。
2012年,藍月亮開設了天貓旗艦店;13年到19年期間,藍月亮冠名了央視和湖南衞視多檔全國性節目。

兩套動作組合下來,使得藍月亮在洗衣液行業的份額逐漸穩固,連續11年市佔率排名第一。2019年藍月亮洗衣液的市佔率接近25%,洗手液市佔率接近28%。而線上洗衣液市佔率超過33%,線上收入佔比也超過了47%。
藍月亮的高成長性也深受資本看好。2010年,高瓴就對藍月亮進行了4500萬美元的獨家A輪融資,並於2011年追加103萬美元。在IPO前,高瓴對藍月亮持股10%,是其第二大股東。
招股書顯示,藍月亮的毛利以及毛利率均呈逐年上升趨勢。2017年至2019年,藍月亮的毛利分別為29.95億港元、38.86億港元以及45.23億港元,毛利率由2017年的53.2%上升至2018年的57.4%,並進一步上升至2019年的64.2%。
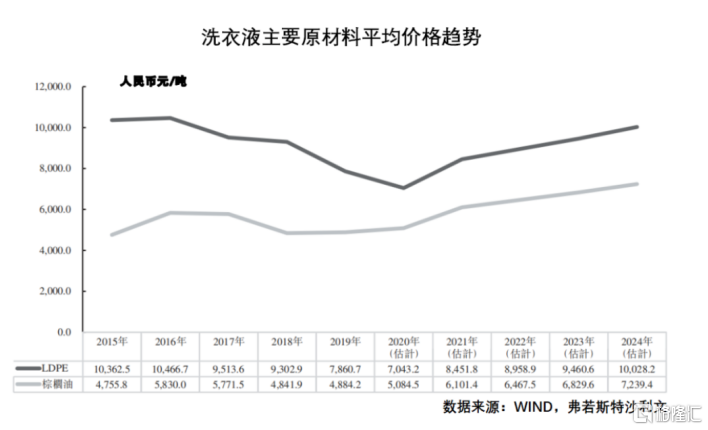
可見,2016年開始,藍月亮淨利潤開始高速增長。但背後的原因之一是洗衣液原材料 - 棕櫚油以及洗衣液包裝的原材料-低密度聚乙烯價格的持續走低。同時,本該重新進入上漲週期的棕櫚油價格,也因為疫情的衝擊遲遲沒有漲價。
而據弗若斯特沙利文諮詢公司的預測,這兩類原材料的價格將自明年開始逐步回升至2016/17年的水平,因此預計藍月亮的利潤率增長也將回歸到幾年前的常態。
不過,藍月亮的銷售費用在過去3年間的佔比持續減少,尤其是廣告開支,自2017佔營收的23.84%,到2019年僅佔9.93%。可見藍月亮的品牌渠道建設以及品牌認知都已非常成熟。
其他財務數據方面,藍月亮在存貨以及週轉上的效率一直在逐步提升。2017年至2019年,藍月亮的存貨總額分別為6.02億港元、5.87億港元和3.76億港元;存貨週轉天數分別為96.8天、73.1天以及69.5天。
洗衣液滲透率的增長空間廣闊
中國家庭清潔護理市場規模預計將在2024年增長至1677億元。2019年,衣物清潔護理為家庭清潔護理市場中規模最大的市場,佔比逾61%。
而細分產品領域,洗衣液產品在日本的市場滲透率接近80%,在美國的市場滲透率高達91%,而在中國市場上的滲透率僅為44%,尤其是在低線城市,洗衣粉、洗衣皂等傳統洗護產品仍佔據部分市場。這是由於下沉市場中洗衣機的普及率也相對有限,而洗衣粉產品在手洗時由於易起泡沫而更容易產生“洗的乾淨”的感覺。但是事實上,洗衣液產品對衣物、皮膚甚至環境的傷害較洗衣粉和肥皂都更小。
因此,隨着消費升級,洗衣機逐漸完成下沉市場的佈局,洗衣液的滲透率仍會有較大的上漲空間。
藍月亮作為洗衣液行業的龍頭,可以在這樣的結構性變化趨勢中收益是一定的。而在此時上市,也可以看做是為日後提高下沉市場競爭力的蓄勢待發。同時,有觀點認為,同類消費股的稀缺會使藍月亮更受資金追捧。
Follow us
Find us on
Facebook,
Twitter ,
Instagram, and
YouTube or frequent updates on all things investing.Have a financial topic you would like to discuss? Head over to the
uSMART Community to share your thoughts and insights about the market! Click the picture below to download and explore uSMART app!

Disclaimers
uSmart Securities Limited (“uSmart”) is based on its internal research and public third party information in preparation of this article. Although uSmart uses its best endeavours to ensure the content of this article is accurate, uSmart does not guarantee the accuracy, timeliness or completeness of the information of this article and is not responsible for any views/opinions/comments in this article. Opinions, forecasts and estimations reflect uSmart’s assessment as of the date of this article and are subject to change. uSmart has no obligation to notify you or anyone of any such changes. You must make independent analysis and judgment on any matters involved in this article. uSmart and any directors, officers, employees or agents of uSmart will not be liable for any loss or damage suffered by any person in reliance on any representation or omission in the content of this article. The content of the article is for reference only and does not constitute any offer, solicitation, recommendation, opinion or guarantee of any securities, virtual assets, financial products or instruments. Regulatory authorities may restrict the trading of virtual asset-related ETFs to only investors who meet specified requirements. Any calculations or images in the article are for illustrative purposes only.
Investment involves risks and the value and income from securities may rise or fall. Past performance is not indicative of future performance. Please carefully consider your personal risk tolerance, and consult independent professional advice if necessary.


