三季度华为5G市场份额继续第一,爱立信迅速飙升10%
近日,市场调研机构Dell'Oro公布了2020年第一季度到第三季度全球5G通信设备的市场份额变化。华为历经波折不过暂时仍然保住了第一的位置。
今年的第一季度,全球的5G通讯设备市场华以35.7%的份额一绝骑尘,高于第二名爱立信(份额24.6%)有10个百分点之多,其他的三位主要设备商的份额分为:诺基亚(15.8%)、三星(13.2%)、中兴(9.3%)。
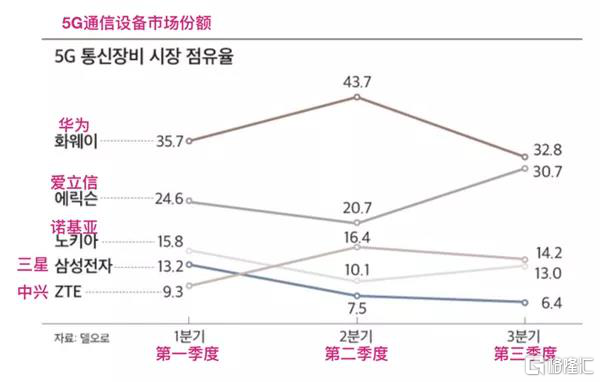
今年第二季度,随着中国5G建设大规模建设启动,华为、中兴的份额暴增,上升至43.7%、16.4%,中兴在全球的通讯设备份额也随之上升至第三。而爱立信、三星、诺基亚这三家的份额集体下跌,其中爱立信的份额下降最大,跌至20.7%,仅为华为的一半不到。
但是到了三季度,华为的份额下降较快,爱立信份额却急剧回升,与华为的份额相差无几,而其他几家公司的份额变化不大。
华为三季度份额下降,一方面是美国对华为的“打压”进一步升级,只要外国公司使用了美国芯片制造设备,就必须获得美国政府的许可,才能向华为或其附属公司提供芯片。华为继续获取某些芯片或使用某些美国软件或技术相关的半导体设计,也需获得美国的许可。台积电等晶圆代工厂无法为华为代工自研芯片,华为面临诸多困难。
另一方面,中国的三大运营商5G建设目标提前完成。据数据显示,中国移动已开通5G基站超过38.5万个,为全国所有地级市和部分重点县城提供5G服务,发展5G终端用户超过9000万户;截至今年10月,中国电信和中国联通共建共享5G网络,累计开通5G基站约33万个,加上两家分别还有少量自建基站,三大运营商累计开通的5G基站已超70万个。
10月底,三大运营商已经超额完成了全年的5G建设目标,华为获得了近半数的份额,华为的5G设备在年中就已完成发货,因此今年上半年华为的5G设备出货量一直快速增长。而三季度及之后国内市场的5G设备出货量陷入停滞,华为在海外市场又受挫折,这是导致三季度华为的市场份额出现大幅下跌。
华为的三季度市场份额下滑了10%,爱立信市场份额增加了10%,这明显是被爱立信所吞掉,成为华为被制裁后的最大赢家。爱立信三季度的拥有30.7%的全球5G通讯设备市场份额,与华为相差仅2.1%。
三季度华为在海外市场遭受重挫,而欧美市场的5G网络建设逐渐展开,爱立信的5G设备出货逐渐进入高潮,由此爱立信的市场份额就出现了激增的势头。
截至目前,爱立信5G商业合同达到118个,其中与68家运营商客户达成可公示的5G商用合同,目前在36个国家为70个已经正式运行的5G商用网络提供设备。
值得一提的是,爱立信还通过并购的方式争夺5G的市场份额。9月18日,爱立信官网披露,爱立信收购了总部位于美国的Cradlepoint公司,收购价为11亿美元(约合人民币74.4亿元)。
Cradlepoint公司以4G和5G专网解决方案见长,尤其是其面向4G和5G专网的Wireless Edge WAN solutions(无线边缘WAN解决方案)。收购Cradlepoint公司,意味着爱立信在5G企业市场的布局深入了很多,企图占领5G企业市场的更大份额。
Cradlepoint公司发展势头极其强劲,有分析师认为Cradlepoint潜在增长率在25%至30%之间,Cradlepoint的专用网络部门和全球物联网平台,提供企业服务的持续战略将成为爱立信企业业务领域技术和新业务的一部分,为爱立信增长提供新的动力。
中国作为全球最为庞大的5G设备市场,并且目前的5G基站数量还不到4G的十分之一,国内的5G市场仍旧有很大的空间;其次,在海外,欧美市场的疫情还较为严重,5G网络的建设力度是否还依旧能够维持原有的强度;美国总统换届,拜登上台,对华为的封锁是否还保持原有的力度等等,5G市场份额的争夺战才刚刚开始。
华为在如此复杂的国际环境之下,仍能保持第一的位置,实属不易。而爱立信的市场份额升至30.7%,迅速崛起的速度确实也不容小觑。由于5G建设还在初期阶段,国际环境复杂多变,使得各大设备商的份额出现了大幅波动,未来也充满更多不确定性。
Follow us
Find us on
Facebook,
Twitter ,
Instagram, and
YouTube or frequent updates on all things investing.Have a financial topic you would like to discuss? Head over to the
uSMART Community to share your thoughts and insights about the market! Click the picture below to download and explore uSMART app!

Disclaimers
uSmart Securities Limited (“uSmart”) is based on its internal research and public third party information in preparation of this article. Although uSmart uses its best endeavours to ensure the content of this article is accurate, uSmart does not guarantee the accuracy, timeliness or completeness of the information of this article and is not responsible for any views/opinions/comments in this article. Opinions, forecasts and estimations reflect uSmart’s assessment as of the date of this article and are subject to change. uSmart has no obligation to notify you or anyone of any such changes. You must make independent analysis and judgment on any matters involved in this article. uSmart and any directors, officers, employees or agents of uSmart will not be liable for any loss or damage suffered by any person in reliance on any representation or omission in the content of this article. The content of the article is for reference only and does not constitute any offer, solicitation, recommendation, opinion or guarantee of any securities, virtual assets, financial products or instruments. Regulatory authorities may restrict the trading of virtual asset-related ETFs to only investors who meet specified requirements. Any calculations or images in the article are for illustrative purposes only.
Investment involves risks and the value and income from securities may rise or fall. Past performance is not indicative of future performance. Please carefully consider your personal risk tolerance, and consult independent professional advice if necessary.


