You are browsing the Hong Kong website, Regulated by Hong Kong SFC (CE number: BJA907). Investment is risky and you must be cautious when entering the market.
創7年新高!鐵礦石為何如此瘋狂?
格隆匯 12-03 15:46

12月2日,國內黑色系期貨漲瘋了!其中,焦煤漲逾5%,焦炭漲逾2%,鐵礦石創2014年以來新高,報收於934元/噸。

3日,鐵礦石2101期貨盤中再度衝高至940元/噸。
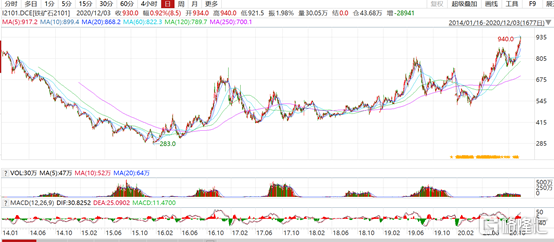
image.png(來源:wind)

對於近期鐵礦石期貨的持續走強,最主要是因為礦市供需格局的變化。

供給端來看,國家統計局數據顯示,2020年1-10月全國鐵礦石累計產量為71450.6萬噸,累計同比增長1.9%,環比下降0.7個百分點,已連續4個月出現下降情況。

而進口方面,巴西淡水河谷11月28日宣佈已收到的礦山生產設施安裝許可證,將恢復帕拉州庫里奧諾波利斯鎮Serra Leste礦山的正常運營,預計2021年產量達400-500萬噸,並在2022年達產至600萬噸。此外,該礦山的擴建項目預計將於2023年上半年啟動,屆時產能將提升至1000萬噸。

巴西淡水河谷供給產能逐年擴張是長期趨勢。但短期內,受到海外澳巴港口檢修的影響,11月份,兩國發運處於中性偏低水平。據Mysteel統計11月16日-11月22日,全球發運總量3003萬噸,環比減少282萬噸。其中澳大利亞發往中國量1268.5萬噸,環比減少145.2萬噸;巴西發貨總量703.4萬噸,環比減少50.6萬噸。

此外,市場傳言印度方面為保證其國內礦石的使用,考慮重新開始禁止鐵礦石出口。

總體上,國內供給端呈現小幅收窄趨勢,海外澳巴發運量周環比亦連續下降,整體供給端改善較為明顯,對鐵礦石行業上漲起到推波助瀾的效果。

需求端來看,終端市場表現亮眼是支撐鐵礦石行情重要因素。在疫情有效控制後,國內經濟加速恢復,數據顯示,11月國內製造業PMI錄得52.1,較10月環比提升0.7個百分點,為2017年10月以來最高值。

得益於國內經濟好轉,2020年1-10月,全國生鐵、粗鋼、鋼材產量分別為74169.9萬噸、87393.3萬噸和108328.1萬噸,同比分別增長4.3%、5.5%和6.5%。

進入11月,全國建築鋼材成交量長時間維持20-25萬噸每天附近的高位,鐵礦石在下游成材強勢的帶動之下緩慢上行,逐漸脱離前期的震盪區間。

11月下旬,全國各地氣温迅速下降,北方飄雪,建築工地施工受到天氣影響,終端需求出現走弱的跡象。截至11月26日,螺紋鋼周產量為360.09萬噸,較年中最高周產量(7月3日)下滑40.77萬噸,但目前仍處於同比近五年來的高位。

整體來看,今年鐵礦石下游鋼材市場需求旺盛,在高爐利潤修復的情況下,鋼廠生產積極性較高,帶動鐵礦石需求向好。

在供減需增格局下,11月鐵礦石港口庫存由增轉降。一方面由於到港量的減少,另一方面則源於海外需求恢復,鐵礦石疏港增加。根據Mysteel數據顯示,11月27日,45港進口礦庫存為12605.40萬噸,較上週下降146萬噸。日均疏港量321.33萬噸,環比下降1萬噸。目前在港船隻亦減少18條至111條。

image.png

(來源:Mysteel,大越期貨)

鑑於供給端邊際收緊,下游需求韌性較強以及庫存下降等方面影響,12月份鐵礦石尚有200-250萬噸的供需缺口,供需處於緊平衡狀態,這也是近期鐵礦石價格屢創新高的主要原因。

不過考慮到淡季需求下,成材或將承壓,鐵礦石上行驅動可能會有所趨弱。

這一波黑色系的上漲行業中,除了鐵礦石之外,焦炭、焦煤等表現也很搶眼。其主要的邏輯同樣因下游鋼廠高爐開工高位,導致需求旺盛,而受環保政策影響下,各地區出台焦炭去產能動作,使得供應減量進而推動雙焦期貨價格上行。

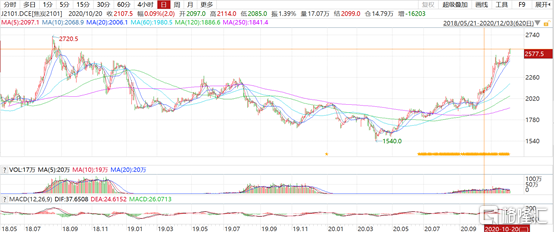
其中,焦煤12月3日盤中創下近3年的新高,達1551.5元/噸。

image.png(來源:wind)

焦炭接近2018年8月的高位區間,即將突破。

image.png(來源:wind)

Follow us
Find us on Facebook, Twitter , Instagram, and YouTube or frequent updates on all things investing.Have a financial topic you would like to discuss? Head over to the uSMART Community to share your thoughts and insights about the market! Click the picture below to download and explore uSMART app!
Disclaimers
uSmart Securities Limited (“uSmart”) is based on its internal research and public third party information in preparation of this article. Although uSmart uses its best endeavours to ensure the content of this article is accurate, uSmart does not guarantee the accuracy, timeliness or completeness of the information of this article and is not responsible for any views/opinions/comments in this article. Opinions, forecasts and estimations reflect uSmart’s assessment as of the date of this article and are subject to change. uSmart has no obligation to notify you or anyone of any such changes. You must make independent analysis and judgment on any matters involved in this article. uSmart and any directors, officers, employees or agents of uSmart will not be liable for any loss or damage suffered by any person in reliance on any representation or omission in the content of this article. The content of the article is for reference only and does not constitute any offer, solicitation, recommendation, opinion or guarantee of any securities, virtual assets, financial products or instruments. Regulatory authorities may restrict the trading of virtual asset-related ETFs to only investors who meet specified requirements. Any calculations or images in the article are for illustrative purposes only.
Investment involves risks and the value and income from securities may rise or fall. Past performance is not indicative of future performance. Please carefully consider your personal risk tolerance, and consult independent professional advice if necessary.
uSMART
Wealth Growth Made Easy
Open Account