全球風險偏好仍較高,美國基金市場資金流趨穩
市場週迴顧
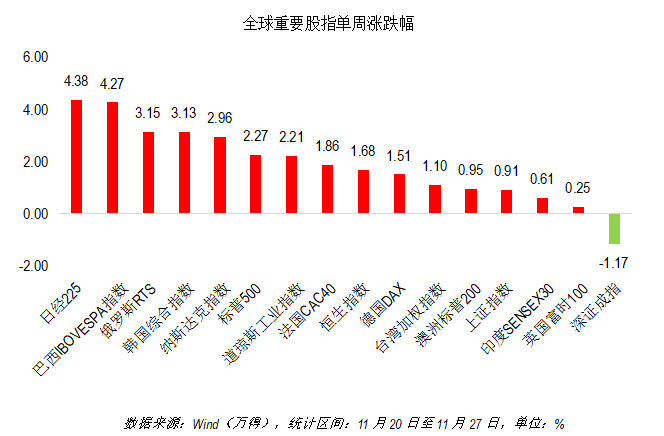
11月20至27日期間,全球各大股指均錄得不同程度漲幅,日經指數以4.38%的漲幅領跑全球,僅深證成指下跌1.17%。美股方面,三大指數上漲2%至3%不等。恆生指數上週表現較爲穩健,上漲1.68%。
行業方面,11月20日至27日期間,MSCI全球一級行業指數全線收漲。其中能源行業指數表現最爲突出,單週上漲7.47%,比漲幅排名第二的金融行業高出4%。

uSMART智選基金觀點
我們之前曾經提到過美國經濟面臨的三大不確定性,分別是疫情,總統交接和刺激法案。就目前形勢來看,總統選情基本塵埃落定。大選的最終結果將於12月8日正式確認,特朗普團隊的訴訟應較難改變大選結果。目前美國正在經歷第三波疫情的衝擊,抗擊新冠是拜登政府在過渡期的執政重心。若抗擊疫情出現成效,經濟重啓步伐將更爲確定。我們抱持一以貫之的長期投資理念,認爲投資者無需擔憂短期市場波動,而應着眼於長期資產價值穩健升值。
海外基金動態
據美國投資公司協會數據顯示,11月11至18日期間,全美各類基金資金淨流出49.1億美元。自年初以來,共計5043億美元撤出共同基金市場。但近幾週數據表明,基金市場的資金流動趨於穩定,淨流出的規模逐漸縮小。

分類別來看,上述統計區間內,合計161億美元資金流出股票型基金市場。而債券基金仍保持強勢勁頭,創造了131億美元的資金淨流入。相比這兩類基金,混合型基金的資金流變化幅度相對較小。

國內基金動態
Wind數據顯示,截止11月25日,今年以來,全國公募基金累計分紅3852次,已分紅1501.94億元,遠超去年全年的1290.41億元。
分類別來看,債券型基金分紅總額達896.79億元,已分紅2963次,均高於其他類型基金。混合型基金分紅494.93億元,僅次於債券型基金。股票型基金分紅總額和分紅次數相對較少,分別爲83.59元和97次。

業內人士認爲,公募基金分紅明顯增加的原因可能與今年基金規模的大幅增長有關,並且債券市場近幾年表現不俗,出於回報投資者的目的,分紅相應地有所增加。
Follow us
Find us on
Facebook,
Twitter ,
Instagram, and
YouTube or frequent updates on all things investing.Have a financial topic you would like to discuss? Head over to the
uSMART Community to share your thoughts and insights about the market! Click the picture below to download and explore uSMART app!

Disclaimers
uSmart Securities Limited (“uSmart”) is based on its internal research and public third party information in preparation of this article. Although uSmart uses its best endeavours to ensure the content of this article is accurate, uSmart does not guarantee the accuracy, timeliness or completeness of the information of this article and is not responsible for any views/opinions/comments in this article. Opinions, forecasts and estimations reflect uSmart’s assessment as of the date of this article and are subject to change. uSmart has no obligation to notify you or anyone of any such changes. You must make independent analysis and judgment on any matters involved in this article. uSmart and any directors, officers, employees or agents of uSmart will not be liable for any loss or damage suffered by any person in reliance on any representation or omission in the content of this article. The content of the article is for reference only and does not constitute any offer, solicitation, recommendation, opinion or guarantee of any securities, virtual assets, financial products or instruments. Regulatory authorities may restrict the trading of virtual asset-related ETFs to only investors who meet specified requirements. Any calculations or images in the article are for illustrative purposes only.
Investment involves risks and the value and income from securities may rise or fall. Past performance is not indicative of future performance. Please carefully consider your personal risk tolerance, and consult independent professional advice if necessary.


