醫療板塊遭遇全面血洗!第二批集採威力究竟有多恐怖?
11月25日,醫療板塊慘遭血洗,醫療ETF重挫2.85%。個股層面,心脈醫療、愛博醫療跌幅居前,凱利泰、心脈醫療等跌逾8%,其餘個股走勢也較為慘烈。
港股方面,微創醫療、威高股份均跌逾5%。
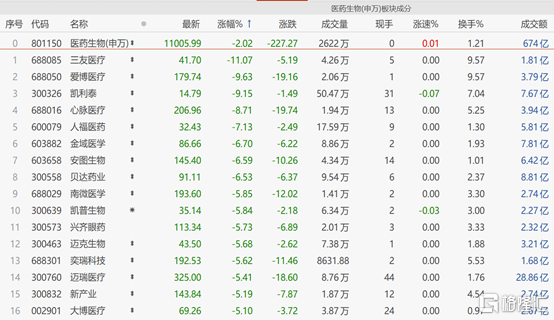 (來源:Choice)
對於醫療板塊集體“撲街”的原因,主要是第二批高值醫用耗材集採來了。
根據《國家醫療保障局全國高值醫用耗材集中採購數據快速採集與價格監測實施方案》,第二批醫用耗材清單主要包括以下類別:人工髖關節、人工膝關節、除顫器、封堵器、骨科材料、吻合器。同時對第一批血管介入類、非血管介入類、起搏器類、眼科類產品進行增補。
此次,涉及產品信息1萬餘條,具體到規格型號約32萬條。
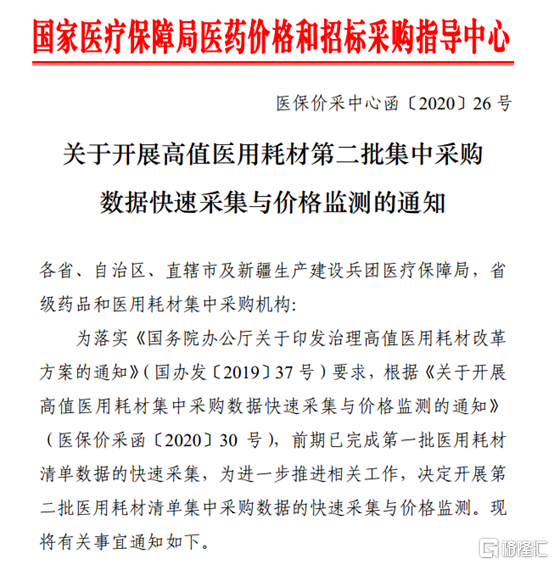
(來源:醫保局)
簡單來説,這次集採主要集中在心血管類、骨科耗材類,都是高值醫用耗材佔比較大的賽道。
心血管耗材方面,2018年國內心血管高值耗材市場規模近400億元,佔高值耗材市場整體的38%左右。
骨科耗材方面,2013-2019年,我國骨科植入耗材市場規模由117億元增長至308億元,年複合增長率約為17.51%。其中,脊柱類產品市場規模由2013年的33億元增長到2019年的87億元,年複合增長率約為17.54%;創傷類產品市場競爭相對激烈,市場規模由38億元增長到92億元,年複合增長率為15.88%。
未來隨着人口老齡化、人均可支配收入提升、進口替代等因素,心血管領域及骨科行業增長空間仍很大。
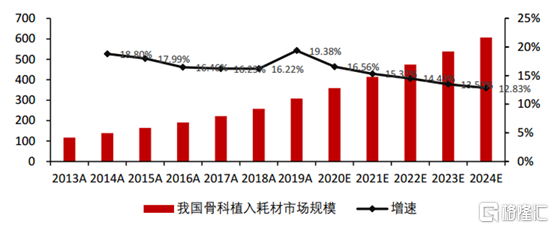
(我國骨科植入耗材市場發展趨勢及預測(億元),來源:東方證券)
此前,相關品種集採已經在部分省市預演,普遍降幅50%左右。譬如2019年9月,江蘇醫保局舉行的第二批高值耗材集採中,骨科人工髖關節平均降幅47.20%。
相較於地方集採,這次國家級集採所涉及的領域更廣泛,且涉及產品規模更大。根據此前經驗來看,這次中標價格降幅或將超過地方集採降價幅度。11月5日,首次國家級醫療器械集採結果公佈,整體冠脈支架從均價1.3萬元左右降至700元左右,降價幅度超過90%。
而集採實施後,產品單價大幅下跌或導致企業利潤下滑,這是市場用腳投票的重要原因。根據西南證券的調研發現,假設三種帶量採購降價幅度,分別為50%、60%、70%,那麼對應產品的淨利率依次是38%-44%、26%-34%、7%-17%。因此企業提升盈利能力只能通過提高銷量或降低相關成本。
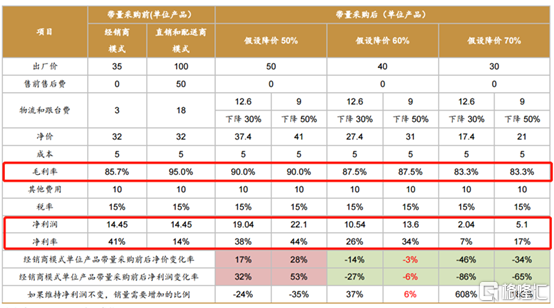
(西南證券耗材帶量採購的影響測算模型,來源:西南證券)
此次集採影響的公司有哪些?
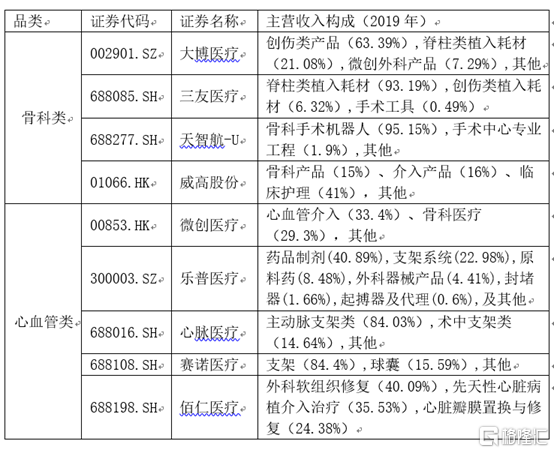
據不完全統計,共有9家上市公司產品涉及此次集採品類。
骨科方面,從2019年主營業務收入佔比來看,大博醫療、三友醫療、天智航-U在骨科領域的收入佔比均達到90%以上。2020年前三季度,上述三家營業收入分別達11.10億元、2.69億元、7644萬元,淨利潤依次為4.35億元、7980萬元、-5347萬元。除此之外,港股上市的威高股份也有15%的收入來自於骨科。
心血管耗材方面,微創醫療、樂普醫療、心脈醫療等公司位列其中。值得注意的是,微創、樂普的部分冠脈支架產品在此前集採中已大幅降價,一定程度上對其短期業績造成不利影響。這次公司產品再次進入集採範圍,對於其而言,可謂是“二次受傷”。
隨着集採步伐越來越快,且威懾力較大。短期內,對相關公司業績影響不容忽視,但長期來看,在外部變化的倒逼下,相關公司將加速進入到更前沿的創新階段,有望重塑市場格局。
(數據來源:Choice)
Follow us
Find us on
Facebook,
Twitter ,
Instagram, and
YouTube or frequent updates on all things investing.Have a financial topic you would like to discuss? Head over to the
uSMART Community to share your thoughts and insights about the market! Click the picture below to download and explore uSMART app!

Disclaimers
uSmart Securities Limited (“uSmart”) is based on its internal research and public third party information in preparation of this article. Although uSmart uses its best endeavours to ensure the content of this article is accurate, uSmart does not guarantee the accuracy, timeliness or completeness of the information of this article and is not responsible for any views/opinions/comments in this article. Opinions, forecasts and estimations reflect uSmart’s assessment as of the date of this article and are subject to change. uSmart has no obligation to notify you or anyone of any such changes. You must make independent analysis and judgment on any matters involved in this article. uSmart and any directors, officers, employees or agents of uSmart will not be liable for any loss or damage suffered by any person in reliance on any representation or omission in the content of this article. The content of the article is for reference only and does not constitute any offer, solicitation, recommendation, opinion or guarantee of any securities, virtual assets, financial products or instruments. Regulatory authorities may restrict the trading of virtual asset-related ETFs to only investors who meet specified requirements. Any calculations or images in the article are for illustrative purposes only.
Investment involves risks and the value and income from securities may rise or fall. Past performance is not indicative of future performance. Please carefully consider your personal risk tolerance, and consult independent professional advice if necessary.


