


來源:騰訊證券
臨近年底,前期強勢的醫藥、科技板塊紛紛回調,唯獨白酒板塊強勢不改。
截至11月12日,金徽酒今年以來股價漲了3倍,最近一個月暴漲超180%;貴州茅台今年漲48%,總市值站穩2萬億;五糧液漲104%,總市值站上1萬億大關。茅台、五糧液分別成為滬深兩市的“市值王”。
“酒業雙雄”為何能夠制霸A股?經過本輪大漲,白酒股的估值與業績是否匹配?從白酒股的三季報可以看出一些端倪。
01
賺錢榜:茅台日賺1.2億,捲走行業一半利潤
公開數據顯示,A股白酒上市公司今年前三季度共賺了690.83億元,其中貴州茅台賺了338.27億居榜首,五糧液(145.45億)、洋河股份(71.86億元)、瀘州老窖(48.15億)緊隨其後。貴州茅台日賺1.2億,一家公司捲走了行業一半利潤(49%)。
從近十年白酒上市公司前三季度淨利潤排行來看,貴州茅台始終霸榜,位居行業第一,從2011年前三季度的65.69億增長至2020年前三季度的338.27億,是名副其實的賺錢機器。
02
毛利率榜:茅台碾壓同行,老窖多次提價毛利攀升
一門生意賺不賺錢,賺錢的難易程度如何,毛利率和淨利率是一個重要的衡量指標。2020年三季度,貴州茅台的銷售毛利率高達91.33%,淨利率為53.33%,碾壓白酒同行。今年以來多次提價的瀘州老窖,三季度毛利率達83.57%,較去年同期增長3.08%,遠超同屬高端白酒的五糧液和洋河股份。
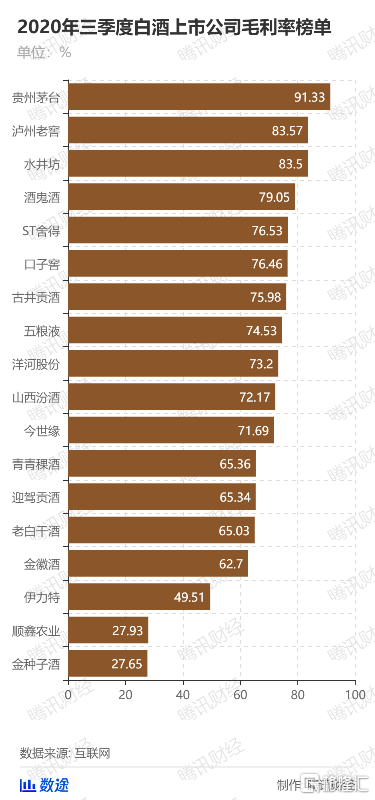
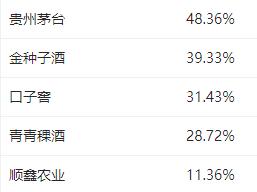
A股市場有一個習慣,將賺錢能力強的行業龍頭公司叫作“X中茅台”。從今年三季度來看,不管是“醬茅”海天味業(42.27%)、“藥茅”恆瑞醫藥(87.72%)、“豬茅”牧原股份(64.67%)、“奶茅”伊利股份(36.94%),其毛利率都無法和茅台相提並論。
03
現金流榜:白酒行業高端化、向頭部公司集中化趨勢明顯
從2020年前三季經營活動產生的現金流量淨額來看,扣除現金流為負的7家公司,合計實現390.27億元,其中貴州茅台實現現金流251.11億元,佔比64.3%。

高端白酒三巨頭“茅五瀘”實現現金流量共318.52億元,佔比81.6%。由此也可以看出,白酒行業出現明顯的高端化趨勢,資源在向頭部公司集中化的趨勢也非常明顯。
04
白酒地圖:四川擁有4家上市公司,五糧液市值破萬億領跑深市
中國白酒的產區可以大致分為長江上游超級產區與黃淮流域超級產區。從18家白酒上市公司的分佈情況來看,也大體一致。從白酒上市公司的數量來看,四川省和安徽省的白酒上市公司最多,均為四家,江蘇省有兩家。
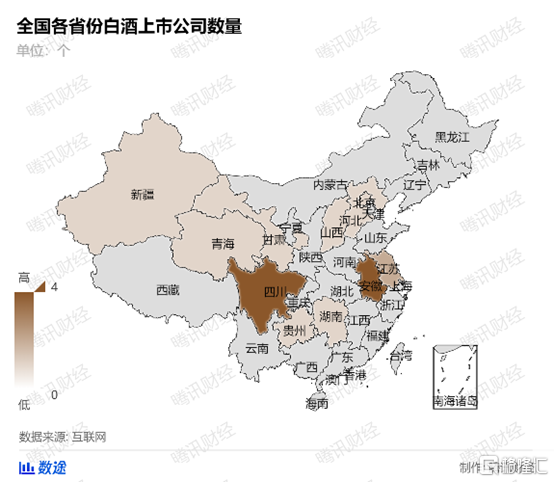
從白酒上市公司的市值排行榜來看,截至11月12日,貴州省居第一位,該省只有貴州茅台一家上市公司,但總市值達2.18萬億,成為A股“市值王”。其次是四川省,該省的4家白酒上市公司總市值是1.39萬億,其中五糧液一家的總市值是1.04萬億,位列深市市值榜第一名。
05
股價漲幅榜:最牛股金徽酒今年漲了3倍,百倍市盈率泡沫大?
從今年白酒上市的漲幅榜來看,分化非常明顯。截至11月12日收盤,今年漲幅榜第一的是金徽酒,年初至今該股漲了近3倍,最近一個月暴漲超180%。從業績情況來看,今年前三季度金徽酒營收和淨利潤雙雙下滑,股價瘋漲主要是由於豫園股份收購公司30%的股份。貴州茅台只漲了48%,在18家白酒上市公司中排名第15位。
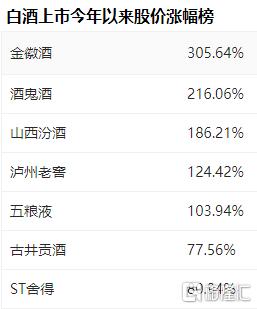
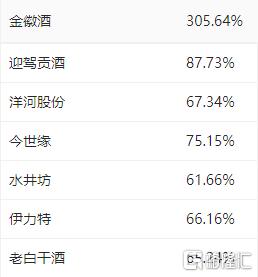
在股價持續大漲的同時,有關白酒股是否泡沫化的問題也引發投資者的熱議。目前貴州茅台、五糧液、瀘州老窖的滾動市盈率在50倍左右,今年漲幅第一的金徽酒超過百倍,漲幅位居第二、第三位的酒鬼酒、山西汾酒均超過80倍。
從中證白酒指數最近10年的市盈率情況來看,中位數在28倍左右,2018年該指數的市盈率頂峯達到39倍,隨後迎來一波慘烈的調整。今年以來,該指數的市盈率持續攀升,目前已經達到創紀錄的50倍。
安信證券認為,白酒整體前低後高Q3增長修復,老窖汾酒利潤彈性突出,地產酒恢復常態增長。2020年1-9月白酒板塊整體收入同比增速4.46%,淨利潤增速10.04%;Q3白酒板塊收入增速11.58%,淨利潤增速14.12%。2020年白酒板塊影響最大因素是新冠疫情,但新冠疫情在三季度的影響已經高度減弱,因而餐飲恢復良好,中秋國慶旺季白酒消費較好。白酒2021樂觀,長期白酒結構性景氣基本態勢不變。
山西證券食品飲料行業分析師和芳芳在研報中指出,目前食品飲料估值位於歷史高位水平,主要在於其業績確定性較高受到資金追捧,白酒板塊內龍頭股以及食品股股價連創新高。雖短期估值較高,但應重視行業的長期價值。


More Content


