7個月暴漲100%,萬華化學Q3業績成色幾何?
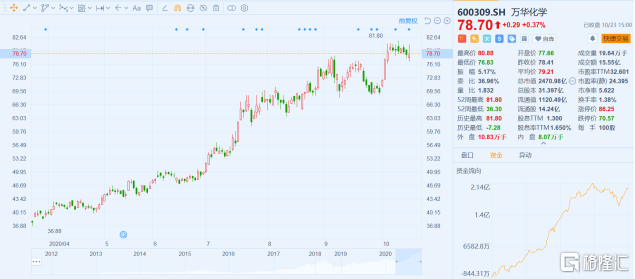
今日,A股化工龍頭萬華化學小幅低開而後震盪上行,午後跳水,一度跌至2%,而後迅速反彈,最終收漲0.37%。今年3月下旬的價格底位至今,萬華化學已累漲100%。
萬華化學於昨晚公佈了第三季度業績,錄得總營收183.25億元,同比增長7.79%;歸母淨利潤25.14億元,同比增長10.3%,環比大幅改善,增長了72.4%。今年前三季度,萬華化學實現總營收492.32億元,同比增長了1.43%。
萬華化學經過多年產業佈局及延伸,目前已經形成聚氨酯(MDI)、石化、精細化學品及新材料三大產業集羣。其中,MDI產品前三季度營收佔比超過50%。這也導致了萬華化學業績隨MDI價格週期波動明顯。
今年前三季度中,公司MDI、精細化學品及新材料的銷量均創出歷史新高。3季度MDI出貨量環比增加了12噸,但由於MDI產品價格雖在8月起略有上漲但仍在低位,公司MDI系列產品營收218.21億元,同比下降8%。
但與此同時,報告期內MDI原材料純苯的價格較去年同期下降了38.1%,因此帶來了MDI產品利潤的提升。
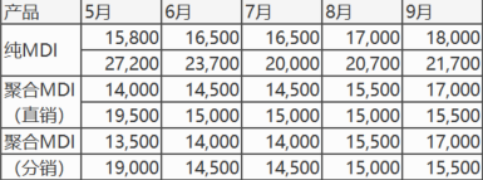
今年上半年,受新冠疫情和原油價格大跌等因素影響,萬華化學產品銷量、價格都大幅下滑。但是3季度,隨着“金九銀十”的到來,特別是10月初紡織產業大量訂單由印度轉移到國內,MDI需求大增,拉動了MDI價格的暴漲。
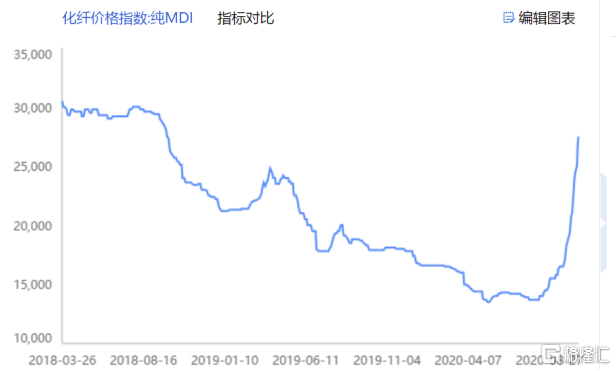
10月1日至今,純MDI價格暴漲了45%,走出一季度的價格低谷,幾乎回到了2018年同期的價格高位。第四季度,韓國、上海等主要供應商裝置紛紛進入密集檢修期,因此供貨緊張,進口貨源也較為有限,因此行業預計MDI的價格還會持續上漲。
而MDI進入10月後價格的暴漲並沒有明顯的體現在第三季度的結算價中,因此第四季度萬華化學的業績環比上漲空間更大。
另一方面,在主要產品MDI表現不振的同時,前三季度石化系列營收159.18億元,同比增長26%,精細化學品及新材料系列營收54.21億元,同比增長8%。
三季度萬華化學的石化裝置檢修完成,開工率的提升也帶來了銷量的恢復。同時萬華位於煙台工業元的百萬噸乙烯項目將於4季度建成投產,石化產品產能將大舉提升。而石化產品價格受石油價格影響,目前還在低位徘徊。
新材料方面,萬華在行業景氣度下行的情勢下逆勢擴張,佈局了技術壁壘及高附加值的新材料以及下游精細化學品領域,預計將在未來五年集中投放,加速向化工新材料行業的轉型。
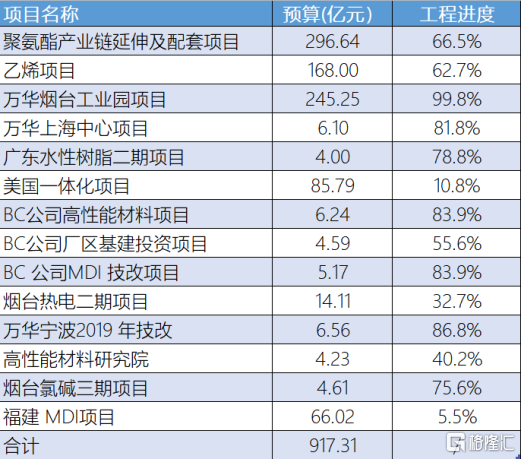
萬華化工自2018年起開始了對產能的大舉擴張。根據萬華化工2020半年報,2020全年共有預算超過900億元的在建工程,多為2018年開始進行的項目。由根據目前各工程的進度,在扣除美國一體化項目和三季度投入的50億後,預計在建工程的待投入資金在200億左右。
3季度末,萬華化學的負債率為63.48%,高於19年同期的54.65%,但報告期內產生的財務費用減少了近2億元。
由於MDI價格暴漲、大乙烯項目將投產,機構普遍看好萬華化學2020/21年的業績。中長期來看,未來五年全球MDI產能將有序擴張,而萬華化學有望進一步鞏固異氰酸酯行業的競爭優勢及龍頭地位。
Follow us
Find us on
Facebook,
Twitter ,
Instagram, and
YouTube or frequent updates on all things investing.Have a financial topic you would like to discuss? Head over to the
uSMART Community to share your thoughts and insights about the market! Click the picture below to download and explore uSMART app!

Disclaimers
uSmart Securities Limited (“uSmart”) is based on its internal research and public third party information in preparation of this article. Although uSmart uses its best endeavours to ensure the content of this article is accurate, uSmart does not guarantee the accuracy, timeliness or completeness of the information of this article and is not responsible for any views/opinions/comments in this article. Opinions, forecasts and estimations reflect uSmart’s assessment as of the date of this article and are subject to change. uSmart has no obligation to notify you or anyone of any such changes. You must make independent analysis and judgment on any matters involved in this article. uSmart and any directors, officers, employees or agents of uSmart will not be liable for any loss or damage suffered by any person in reliance on any representation or omission in the content of this article. The content of the article is for reference only and does not constitute any offer, solicitation, recommendation, opinion or guarantee of any securities, virtual assets, financial products or instruments. Regulatory authorities may restrict the trading of virtual asset-related ETFs to only investors who meet specified requirements. Any calculations or images in the article are for illustrative purposes only.
Investment involves risks and the value and income from securities may rise or fall. Past performance is not indicative of future performance. Please carefully consider your personal risk tolerance, and consult independent professional advice if necessary.


